Development Watch
part 1
Several pro-government letter writers have argued that Guyana has maintained sound macroeconomic fundamentals or macroeconomic stability. Of course, the IMF and World Bank are usually invoked as Minister Robert Persaud did recently (SN 07-06-09). I guess because the IMF and WB say so it must be correct. However, it is far from being this simple and it would take another column, which would be done soon, to discuss the mandates of these two Bretton Woods institutions and whether these are consistent with economic development aspirations of Guyana.
Exactly what the government means by sound macroeconomic fundamentals is not clear; but usually a stable and relatively low rate of inflation is implied (see M. Lowden, SN 11-07-2009). I will use this column to examine and probe the extent to which Guyana has stabilized since 1993. I will use a broad definition of macroeconomic stability proposed by economist Jose Antonio Ocampo who was the former United Nations Under-Secretary General for Economic and Social Affairs. According to Professor Ocampo, macroeconomic stability should encompass price stability, sound fiscal policies, sustainable current account on the balance of payments, sustainable debt ratios, and a well-functioning real economy.
My main argument in this column is the focus on stability without production transformation is misplaced and downright wrong. The supposed stability we have witnessed over the past few years is dependent on foreign aid and life support from the international financial institutions. In addition, last week I have also noted that remittances have played an important role in stabilizing the foreign exchange market and propping up private consumption given the altruistic nature of the inflows (I have cited a well done empirical study on Guyana on which I based my argument that these inflows are altruistic; the government commentators have used opinion to say otherwise).
My primary argument is stability ought to be rooted in production transformation. In other words, stability can be achieved by focusing explicitly on economic growth from the creation of new high productivity production sectors rather than focusing explicitly on a strategy of foreign aid and remittances. I define production transformation in the following ways. First, the Guyana economy should move away from producing goods that are unimportant in the global hierarchy of products. Typically we ought to produce things that would be demanded more as the rest of the world’s (and Caricom’s) income rise. Clearly, sugar and rice paddy do not fit this definition. Second, we should be moving away from sectors susceptible to diminishing returns. The latter represents sectors from which you cannot achieve significant new production growth.
The analysis will be done over two columns. This column (part 1) will examine the measures of macroeconomic stability similar to those proposed by Jose Antonio Ocampo. Next week (part 2), I will investigate whether Guyana’s real economy is indeed a well-functioning one. In other words, I will demonstrate that the production structure has remained rooted in the past low productivity sectors and as a result the narrow focus on macroeconomic stability as price stability has little or no meaning for long-term economic development.
The inflation rate
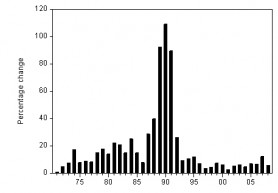
Using data from the Bank of Guyana, figure 1 shows Guyana’s annual inflation rate since 1971. The chart shows a clear slow down in inflation from 1992. The very high inflation from 1988 to 1991 resulted from the period of economic adjustment under the Hoyte ERP that the country had to undergo. This period witnessed the devaluation of the Guyana-US dollar exchange rate and thus the increase in inflation. However, the Hoyte policies appeared to have worked by 1992 as inflation fell to 26% from 89% in 1991. In 1990 inflation was the highest at 109%. By 1993 the rate stabilized at around 9%. Therefore, inflation was already on a downward path.
In general the mean inflation rate for the 1971 to 1992 period was 27.1%, while the arithmetic mean for the 1993 to 2008 period was 7%. If we take out the adjustment period and calculate the mean inflation rate from 1971 to 1987 we get 14%. Historically, therefore, Guyana has not been a high inflation country. But at the same time we will see next week Guyana’s production structure has remained virtually unchanged. Hence, reinforcing the point I have made in the letter columns that our key economic problem has never really been that of short-term stabilization, but rather a failure to upgrade the production structure.
Figure 1, Guyana inflation rate – 1971 to 2008
Data source: Bank of Guyana Annual Reports (various years)
The twin deficits and aid inflows
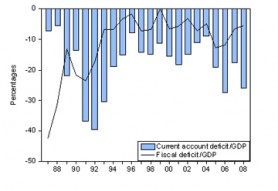
The purpose here is to situate the reduced inflation rate since 1993 within the context of a broader measure of macroeconomic stability. Thus we now examine the twin deficits – the current account deficit (which occurs on the balance of payments) and the government’s fiscal deficit (tax revenues minus spending by central government). There is usually a close relationship between these two deficits – hence the term twin deficits. As you can see figure 2 tends to confirm this relationship to some extent. The bars represent the current account deficits, while the line-graph the government’s fiscal deficit. These are all measured as a percentage of GDP. I only possess data on my computer from 1987 to 2008, hence the chosen time period.
Both deficits increased precipitously during the Hoyte adjustment period as one would expect. They then showed signs of decreasing by 1994 – in other words, the Hoyte adjustment was already taking the economy on a stable path. This stable path was maintained by the current government with the help of the IMF, World Bank and IDB. However, one thing we should note is the percentages could be artificially higher during the Hoyte years because the underground economy was larger in that period owing to the strict regulations in the economy.
Figure 2, Current account and fiscal deficits as a percentage of GDP – 1987 to 2008
Data source: Bank of Guyana Annual Reports (various years)
In recent years, however, the current account deficit has widened to 27.5% of GDP in 2006, 17.7% in 2007 and 26% in 2008. This does not seem to be the stable macroeconomic fundamentals as some would make us believe. As a matter of fact, these percentages are very high and would usually precipitate a currency crisis and financial problems in many other countries. However, why has this not occurred in Guyana? There are several possible answers. First, Guyana has never attracted the kind of hot money or portfolio capital inflows into our financial system (moreover the latter could be due to the underdeveloped nature of the financial system). Furthermore, many economic studies have demonstrated that hot money inflows (foreign cash investments into the stock exchange, bond markets and bank accounts) are a critical ingredient for a systemic crisis and it is actually a good thing the country did not obtain such inflows. Second, remittance inflows are stable (altruistic) and do help to add a sense of stability. Third, the Bank of Guyana (BOG) has not financed the government fiscal deficit by printing money. The BOG ought to be commended for that. Fourth, aid inflows have taken on a larger role since the Hoyte reform years.
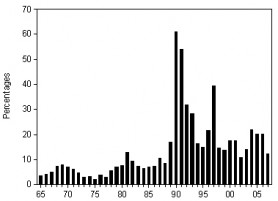
Let us further examine the issue of foreign aid in the economic strategy of Guyana. Figure 3 presents foreign aid as a percentage of GNI (the income counterpart of GDP). It is clear from the chart that since 1990 aid has played an important role in Guyana. However, since the aid numbers are divided by GNI to form a percentage, they could be overestimated during the pre-1993 period when the underground economy was a lot higher. One thing is clear from figure 3 – foreign aid now forms a larger percentage of GDP (or GNI).
Figure 3, Aid as a percentage of Gross National Income (GNI) – 1965 to 2007
Data source: World development Indicators, electronic access
External debt
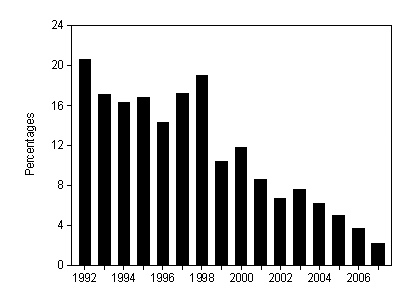
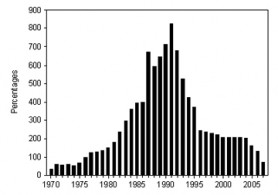
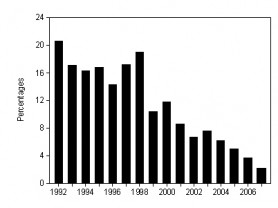
The external debt burden – measured as a percentage of GNI – has declined significantly since 1993. Figure 4 illustrates the external debt stock as a percentage of GDP. The debt stock as a percentage of GDP has declined significantly from 526% in 1993 to 73.3% in 2007. The debt service ratio – measured as debt service payments on IMF and a few other foreign loans divided by exports – has also declined substantially from 20.6% in 1992 to 2.2% in 2007. Unfortunately, I could only obtain data on the debt service ratio from the World Development Indicators since 1992. This does not include all of Guyana’s external debt, but I suspect the trend would have been the same downward movement as illustrated by figure 5.
Figure 4, External debt stock as a percentage of Gross National Income (GNI) – 1970 to 2007
Data source: World development Indicators, electronic access
Figure 5, Debt service ratio – 1992 to 2007
Data source: World development Indicators, electronic access
Conclusion
This column argued that Guyana has re-stabilized from a narrow price stability perspective since 1993. As I have noted, Guyana is not really a historically high inflation country except during the period of needed economic adjustments from 1988 to 1992. Moreover, if one looks at the current account balance, it is hard to claim the country has really stabilized in the macroeconomic sense. However, there has been significant improvement in the external debt burden (this does not include domestic debt). Next week I will show that our economy has remained virtually the same from a production perspective – hence there could be no real macroeconomic stability unless there is structural production shifts into things the rest of the world really wants.

