Estimating the proceeds of tax evasion, regulatory avoidance and organized crime in Guyana
 Introduction
The underground economy (or whatever else it may be termed) along with its phantom segment as I have defined it in last week’s column, is extremely difficult if not impossible to measure accurately. Every estimate contains a margin of error, some wider than others. As a rule I would be very suspicious of claims made by any researcher, who suggests that his or her estimate is definite. The results provided in this column from the several attempts to measure the underground economy in Guyana should be treated as rough indicators of its likely size. If not precise, however, they are at the same time far more reliable than figures obtained from guessing or folklore.
Because underground activities are rooted in 1) tax-evasion 2) non-compliance with regulatory requirements and 3) organized crime, as I indicated in last week’s column, it is difficult to attempt to measure it directly. There have been some efforts to do so by means of surveys and interviews, and also seeking permission to access tax records so that the gap between ‘reported’ income and ‘apparent’ income as derived from one’s life-style can used to estimate unreported income. Generally, it would be a fair conclusion to state that these direct measures aimed at measuring the underground economy have gotten nowhere, and are generally considered as very unreliable. The truth is that it can hardly be expected otherwise, since someone involved in breaking the law is not likely to disclose this to unknown and anonymous researchers.
Indirect methods
Because of such difficulties, the vast majority of researchers resort to utilizing indirect estimations of the underground/illegal economy. The six studies of Guyana’s underground economy, which I cited in last week’s column, utilize four of these indirect methods. The first of them (Thomas 1989) utilized measures of monetary (currency and deposits) and income (GDP) behaviour to measure the income generated in Guyana that was not captured in its official reported GDP for the period 1982-86.
The second study (Bennett 1995) measured the behaviour of currency demand relative to the demand for demand deposits held in the banking system, as an indicator for the size of the underground economy in Guyana, for the period 1977 to 1988.
The third study (Faal 2003) utilized a demand for currency approach but seeks to establish this through econometric modelling. It models the demand for currency as a function of income, tax rates, income foregone by holding cash (the interest rate), the inflation rate and financial innovation (for example, the increase in ATM machines and bank branches). He produced results for the period 1970 to 2000.
The fourth study produced by Thomas, Jourdain and Pasha utilized the methods employed in the three previous studies mentioned above (Thomas, Bennett and Faal) and applied these to the recent period 2001-2008. However, because the Faal econometric method required a longer time-series dataset, although the emphasis of the study was to establish what sort of estimate would result if this technique was applied to more recent years (2001-2008), results for the longer period 1977-2008 were obtained.
The fifth study produced by Vuletin also employed econometric model building, but this time instead of concentrating on one indicator of the size of the underground economy Vuletin considered multiple indicators and multiple causes for the underground economy. These are called MIMIC models and covered Guyana (along with several countries) for the period that he described in the study as the “early 2000s” (using data mainly for 2002 and 2003).
The most recent study (Pasha and Jourdain) utilized an econometric currency demand model and covered the period 1968-2009.
What do the results show?
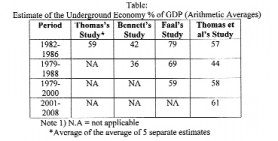
In order to be brief, the results from the first four studies are summarized in the Table below for the years in which they overlap.
 The Vuletin study produced three estimates for the “early 2000s” and the arithmetic average of these three is an underground economy that was equal to 44 per cent of GDP.
The most recent study (Pasha and Jourdain, 2010) covers the longest period (1968-2009). The results show a rise in the size of the underground economy from 1.5 per cent of GDP in 1968 to approximately 31 per cent of GDP in 1988, the year before the Economy Recovery Programme (ERP) was started. Between 1989 and 1999 the underground economy contracted from 30 per cent of GDP to 26 per cent of GDP. In the recent period (2000 to 2009) the underground economy represented about 30 per cent of GDP.
Because of problems identified in these studies I would not encourage readers to go further than to claim that the underground economy remains significant for Guyana, despite the measures undertaken to liberalize the economy in the period of the ERP and after. The two estimates for the present decade (2000s) vary between 30 and 61 per cent of GDP at current prices. This represents a considerable sum of money; that is, between US$600 million and US$1.2 billion calculated on the rebased GDP (2006 prices) or about two-thirds less if we use the no longer used GDP data based on 1988 prices. In Guyana dollars the sums are outrageous ranging from G$120 billion toG$240 billion (thousand million).
Next week I shall round off this discussion and move on to another topic.

