Last week I described the three categories of government expenditures which feature in measures of these, if we are to make a reasonable determination of the size and likely impact of government activity on the economy. These are 1) central government expenditures; 2) the expenditure of public enterprises; and 3) tax expenditures. There is very little data on tax expenditures for Guyana, so that the estimates of government expenditures provided below understate their actual size. This is more so given that I have also excluded data on offsets and the impact of government regulations on economic activity.
Three observations
 Before turning to the results for measures of the size of government in Guyana’s economy, I wish to make three crucial observations. The first is that it is my belief that there is no statistically satisfactory way of determining a priori the right size for government in the economy. Several neo-liberal writers have tried to determine a statistical relation between the size of government and rates of economic growth. None of the studies I have seen so far are technically sound. Indeed, as I shall argue at great length later, it is not the size of government in the economy per se that is the key issue for consideration. What is crucial is whether the government’s use of resources (whether central government, public enterprises or tax expenditures) is more efficient and effective in satisfying society’s goals than the private and other non-government sectors of the economy. It should be pointed out that these goals are always broader than pure economic efficiency, important as that will always remain. In Guyana these goals would certainly have developmental objectives as an important component.
The second observation has been employed as a foundation principle throughout my discussion of these issues so far. That is, comparisons of the size of governments between countries will remain spurious, unless we clearly define what constitutes the numerator in the measure of size (government expenditures) and the denominator (the national accounts aggregate employed).
The third observation is that focus on the size of government expenditures should not distract us from paying close attention to the composition of government spending as well. Over time this composition will be expected to change, often times reflecting the incumbent government’s priorities. It would also differ between countries. In Guyana the key financial categories include interest payments; defence; law and order; transfers; purchases of goods and services; and personnel emoluments (wages and salaries, allowances and contributions). Further, the composition would also reflect the economic sectors government prioritizes, for example, finance, housing, education; health; transport and communication; or sport, recreation and culture.
What the data show
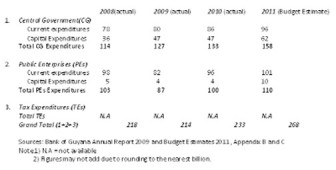
Schedules 1 and 2 summarize the results. Annual total central government expenditures for the period 2008 to the Budget proposal for 2011, have risen from $114 billion to $158 billion. This is an increase of 39 per cent over the four years. In this period, the share of current expenditures rose from $78 billion to $96 billion, or 23 per cent, while capital expenditures rose from $36 billion to $62 billion, for an increase of 72 per cent.
Schedule 1: Government Expenditures 2009-2011 (Budget) G$ billion

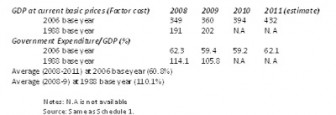
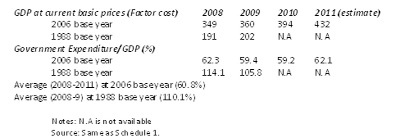
Schedule 2: Size of Government – Government Expenditures/GDP At Current Basic Prices (Factor Cost)

The data on public enterprises reveal that over the same period there was a rise in total expenditures from G$103 billion to G$110 billion. This is an increase of just under seven per cent. The bulk of these expenditures are current. These rose from $98 billion to $101 billion, or just under three per cent, while the much smaller capital expenditures rose from $5 billion to $10 billion.
Tax expenditures are excluded from the measurement displayed in the Schedules because I do not have the data. The grand total however, for central government and public enterprises expenditures rose from $218 billion to $268 billion over the four year period. This represents an overall increase of 23 per cent.
The data on government expenditures for 2008 and 2009 presented in the Schedules are obtained from the Bank of Guyana Annual Report for 2009. The data for 2010 and the Budget proposal for year 2011 are obtained from the Guyana Estimates presented to the National Assembly by the Ministry of Finance for 2011. The national accounts data are obtained from the Bureau of Statistics.
Since the rebased national accounts are being used exclusively from 2010, I utilize the GDP at current basic prices (base year 2006), for the years 2008 to the Budget estimate for 2011. The years 2008-9, for which I also have data based on 1988 prices, I utilize these for purposes of comparison.
The results are striking. If we utilize the GDP data based on 1988 prices as the denominator, the size of government activity averages 110 per cent for the years 2008-2009. If, instead we use the rebased (2006 prices) estimates the resulting ratio overages 61 per cent for the same year. Utilizing the 2006 rebased series for the entire period (2008-2011) the results still show an average size of government of 61 per cent.
The conclusion is unmistakeable: the size of government in the national economy is huge. The question we address next is: Is big government too big? And, if it is, why is that so?


