Introduction
In last week’s column I had presented time series information pertaining to GuySuCo’s factory performance for the two decades of the 1990s and 2000s. These data revealed that the factory conversion ratio for tonnes cane per tonne sugar, showed a definite improvement in performance, particularly when compared to the other indicator (tonnes cane per tonne sugar) which I had presented in the previous week’s column.
As readers should already know, in 2009 GuySuCo operated eight sugar factories; four of these in Berbice and the remaining four in Demerara. There has also been, for years now, a marked difference in the performance between these two counties in terms of tonnes cane per tonne sugar production and therefore we might say general factory efficiency. Overall, however, all eight of GuySuCo’s sugar factories suffer from serious diseconomies of scale. These are due to their comparatively small size on a global scale. Inevitably therefore, other factors being equal, we should expect their unit costs to be higher than those for larger units. Nonetheless, it should be recognized that this does not negate the commercial requirement that every effort is made to maximize internal efficiency and reduce costs, given the scale/size of the operating sugar factory.
 In 2009 the four Berbice sugar factories produced 151,000 tonnes of sugar. For the same year sugar output for the Demerara factories was 83,000 tonnes of sugar. National output was 234,000 tonnes of sugar.
There has been significant variability in the annual output of GuySuCo’s factories. Thus for 2009 output ranged from a low of just over 18,000 tonnes of sugar at La Bonne Intention (LBI) to just over 52,000 tonnes at the Albion factory. The mean output for all the sugar factories in 2009 was 29,000 tonnes of sugar. However, all the Demerara estates produced sugar well below the national average. Not surprisingly therefore, the mean size of output for the Demerara sugar factories for 2009 was only 21,000 tonnes of sugar as against a mean size of 38,000 tonnes for the Berbice sugar estates.
Available data on the average weekly grinding hours for the eight factories offer some useful insights. Thus in 2009 the average grinding hours for all eight factories were102 hours during the first crop and 106 hours during the second crop. Predictably, however, the Berbice factories had averaged 114 hours (ranging from 89 hours at Skeldon to 126 hours for Blairmont) while the Demerara factories had averaged only 89 hours (ranging from 78 hours at LBI to 97 hours at Wales).
The revealed performance among the eight sugar factories shows wide fluctuations from year to year. For example, between 2008 and 2009 (the two most recent years for which I have information), the differences in the sugar production data by estate range from a high of plus 40 per cent for Skeldon to a low of minus 16 per cent for Wales, even though the overall national change in annual output of sugar for the two years was only plus 3 per cent!
Overall performance index
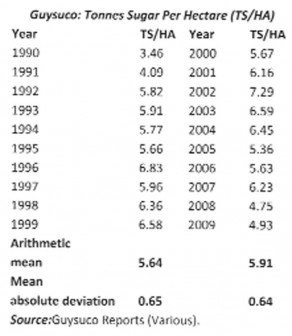
I turn next to combine the data on agricultural performance (tonnes sugar cane per tonne hectare) with the factory performance data (tonnes cane per tonne sugar). These results are revealed in the overall index: tonnes sugar per hectare of sugar cane planted and harvested. Sugar yield per hectare of land is indeed the most common measure of overall industry efficiency used by analysts. As in the case with the other performance indicators, the data on this for the two decades of the 1990s and 2000s are summarized in the table below for readers’ convenience.
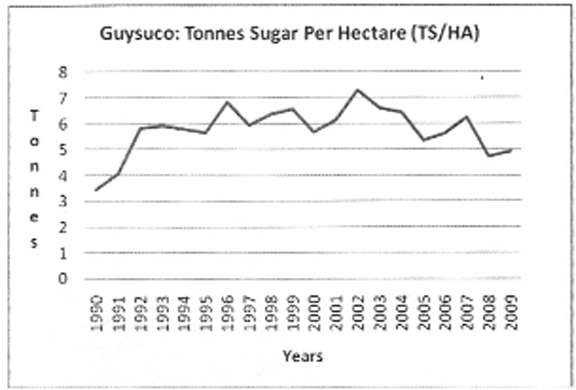
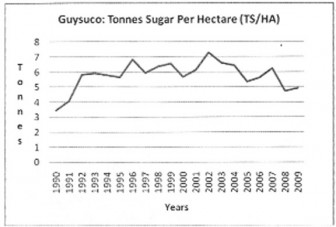
When considering these data readers should first note that, improbable as it might seem, as far back as 1960 the sugar yield per hectare was as high as 8.40 tonnes! By comparison, in only one year during the past two decades has the sugar yield per hectare exceeded 7 tonnes. That occurred in 2003, when it reached 7.29 tonnes sugar per hectare. The mean yield for the 1990s was 5.46 tonnes of sugar per hectare, and for the 2000s, 5.91 tonnes sugar. As can be seen, the difference between the two is marginal, and not surprisingly therefore, the mean absolute deviation is almost the same for the two decades of the 1990s and 2000s ― 0.65 and 0.64 respectively. The graph below illustrates the trend/pattern clearly.
Next week I shall wrap up the discussion on GuySuCo’s performance indicators and start a discussion of the Skeldon Sugar Modernization Project (SSMP). The SSMP has been GuySuCo and the government’s most direct response to halt the disastrous rot in the sugar industry.


