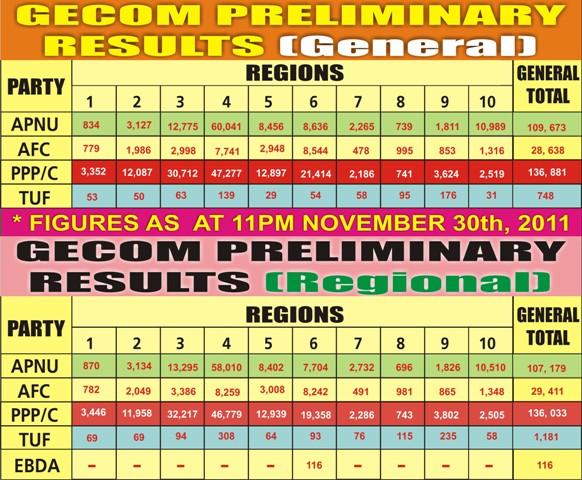
Below is a table showing the preliminary 2011 elections results as they are released by GECOM. (Last Updated: 9:48AM)
This page will be updated as more information becomes available.
| Region | APNU | AFC | PPP/C | TUF |
|---|---|---|---|---|
| 1 | 834 | 779 | 3352 | 53 |
| 2 | 3176 | 2021 | 12317 | 51 |
| 3 | 13695 | 3180 | 32057 | 65 |
| 4 | 63437 | 8168 | 49339 | 145 |
| 5 | 8459 | 2965 | 13038 | 29 |
| 6 | 10407 | 10688 | 29497 | 74 |
| 7 | 2701 | 491 | 2324 | 62 |
| 8 | 739 | 995 | 741 | 95 |
| 9 | 1817 | 874 | 3683 | 176 |
| 10 | 11040 | 1328 | 2628 | 31 |
| Totals (All Regions) | 116305 | 31489 | 148976 | 781 |
Total Electors: 475, 496
Percentage of Votes Counted: 62%~


