As part of my continuing assessment of the 2012 National Budget I attempted two tasks in last week’s column. The first was to complete the ongoing discussion of the secular decline in public sector financial management over the past four decades. This was followed by a brief description of the categories of domestic debt, external debt and total debt as well as the overall balance of the Guyana public sector, to be used as an introduction to this week’s portrayal of the performances of these economic concepts during the 2000s.
The valley of debt
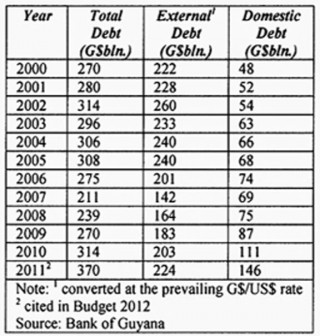
In my view the behaviour of the absolute values of Guyana’s domestic, external, and total public sector debt stock in the 2000s offers an insight into one of the Budget’s key aspects. That is, what it indicates for the economic outlook and challenges to medium term macroeconomic stability of the economy. As the data in Table 1 reveal, the stock of total national debt stood at $270 billion in 2000, and by the end of last year (2011), this had reached $370 billion, an increase of about 37 per cent. This has been quite a surprising increase during the 2000s coming as it did after the long struggles to get out of the valley of the (Highly Indebted Poor Countries, HIPC) debt crisis in the 1990s. The last thing Guyana can afford now is to return to the shadow of the valley of debt.
 Looking more closely at the components of the total debt stock, we find that during the 2000s external debt has accounted for the bulk, averaging about three-quarters of the total. The domestic debt stock, although considerably smaller (averaging about one quarter of the total during the 2000s), more than trebled in value during this period. For its part the external debt, however, remained approximately the same in 2000 as in 2011; that is, approximately US$1.2 billion (for readers convenience the external debt is presented in the Table in Guyana dollars, using the prevailing G$/US$ exchange rate for conversion).
 Table 1: Total, External and Domestic Debt (2000s)
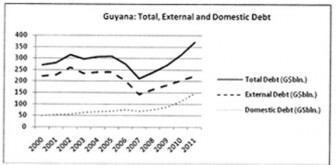
The data in Table 1 are reproduced/illustrated in Graph 1 below. This graph clearly indicates total debt was at its lowest level in 2007 ($211 billion) mainly on account of the decline of the external debt to $142 billion in that year.
The debt to GDP ratio
Important as the performances of the total absolute debt stock and its components are in revealing macroeconomic challenges that can arise over the medium term, as I have previously pointed out, the debt/GDP ratios are far more important in this regard. Regrettably, it is not possible to produce a long-term series of these ratios because of major adjustments to the calculation of the GDP series made in 2006.
Readers would recall from earlier columns that 2006 was the year when the preparation of the National Accounts aggregates ceased using the previous price series base, which was constructed in 1988. A new price series base has been constructed utilizing 2006 prices. The major consequence of this is that, starting in 2006, the new National Accounts aggregates have generally increased in size by between two-thirds and three-quarters. Thus for example, using 1988 prices, the GDP at current factor cost totalled $154 billion 2006. But, when calculated on the basis of 2006 prices, the equivalent measure resulted in a total of $263 billion at current basic prices!
 Obviously calculating debt as a percent of these two widely differing numbers would yield widely different ratios. Since in practice the new 2006 price series base has replaced the previous 1988 price series base, this has become the new official base from which Guyana’s GDP is presently calculated, and rightly so.
I do not wish to discuss yet again my previously expressed concerns that, while officially the use of the new 2006 price series is intended to improve the accuracy of measurement compared to the old 1988 prices, the highly significant differences in the values of GDP create equally highly significant differences in calculations based on these. Consequently I would urge over the next few years a dose of caution when using the new 2006 values as either a numerator or denominator for purposes of economic calculations.
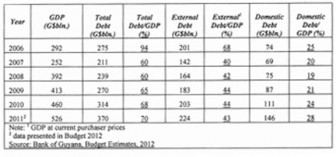
The data in Table 2 below reveal the behaviour of the various components of the public sector debt stock as ratios of GDP for the period 2006-2011, utilizing the new 2006 price series for which the data are available. While I shall discuss these results more fully next week, it is immediately evident that the total debt to GDP ratio has been high (60 per cent and above) with a strong tendency towards increasing during the most recent three years (that is, from 60 per cent in 2008 to 70 per cent in 2011).
 Table 2: Guyana: Debt/GDP Ratios (2006-2011)
Next week I shall continue the discussion from this observation, as I seek to portray challenges to medium-term macroeconomic stability as the country runs the risk of once again entering the notorious valley of debt.


