Indicator
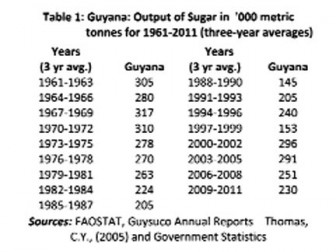
Perhaps the single most revealing performance indicator of the state of Guyana’s sugar industry is to be found in its annual production figures. For this purpose, I have updated a table that I had previously used in columns dealing with sugar and offer it below in the form of a long-term series of Guyana’s annual sugar output covering five decades, from 1961 to 2011. To make the table concise, I present the data on the basis of 3-year averages. Certain performance features are immediately evident.
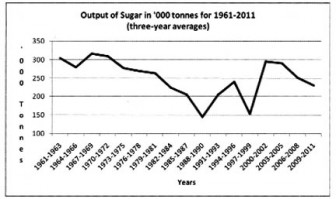
First and foremost, the overall trend of production over the past fifty years has been downwards. On average, annual output had  peaked in the 1960s at over 300 thousand metric tonnes. This output continued at approximately the same level into the early 1970s, where it averaged 294 thousand tonnes for the period 1970 to 1975. The steepest declines, however, occurred after this, during the 1980s and 1990s. The two lowest 3-year average production levels over the last fifty years have occurred in 1988-90 and 1997-1999, where the output levels were only 145 and 153 thousand metric tonnes, respectively.
Annual output picked-up in the first half of the 2000s, when it recovered to average 294 thousand tonnes (similar to the early 1970s). Unfortunately, however, since then, the three-year average annual output has declined by over one-fifth. Indeed, it has averaged only 230 thousand metric tonnes for the most recent three-year period (2009-2011).
The downward trend in output is, as would be expected, more sharply revealed in the graph below. What is also very evident from the graph is the wide variability in the levels of output over the period, even though because the data are presented on the basis of three-year averages, this would statistically dampen the swings in annual output levels.
It would be useful at this stage for readers to note the key descriptive statistics revealed in the data. First, the range in output is considerable — 172 thousand metric tonnes. This exceeds the minimum three-year average production level of 145 thousand metric tonnes in1988-90. The maximum output level was 317 thousand metric tonnes for the period 1967-1969 and the mean (average) value of output for the 50 year period has been approximately 248 thousand metric tonnes. This arithmetic mean was close to the median value of 251 thousand tonnes. The mean absolute deviation for the data in the Table/Graph is 44.2, and the standard deviation 54.5. If the standard deviation (54.5) is divided by the mean value (248), this shows the coefficient of variation (which measures the relative dispersion around the average (mean) value) as 0.22.

At this point readers should recall from previous columns that, when Guyana’s sugar output had peaked in the 1960s, the West Indies as a whole was producing as much as 1.4 million metric tonnes of sugar. There were at that time 10 countries producing sugar for export and the West Indies was classed as the world’s ninth (9th) leading producer of sugar worldwide. Today, the region’s output is insignificant globally, at 0.004 per cent of world production.
Sugar targets
To make these annual production data more meaningful, readers should compare them to the targeted levels of output over the years.
To begin with over the medium to long-term and contingent on the implementation of the field and factory capacity changes of the Skeldon Sugar Modernization Project (SSMP), the original output target for Guyana was set at 450,000 metric tonnes of raw sugar annually. This was the target posted on GuySuCo’s website. However, as domestic production faltered and the original target seemed more and more unattainable, the authorities substituted a reduced target of 400 thousand tonnes of sugar. The media have in recent years consistently repeated this new target without offering any explanation of why there has been a reduction, even though from time to time, analysts (like me) have pointed this out to them.
Second, it is worth noting the most recent targeted levels of output for 2011 and 2012 and to compare these to the actual production levels for those years. This is presented in the Schedule below.
*Readers should note that the first crop for 2012 compares to a first crop output of 106,871 tonnes for 2011; a decline of more than one-third!
From the Schedule above we can see how abysmal has been the industry’s performance.
Next week I shall continue the discussion from this observation.


