Part 2
Introduction
This week I continue the discussion of the burden of Guyana’s public indebtedness since the official introduction of its rebased 2006 price series GDP estimates. Last week’s column provided a brief glimpse of what I have labelled ‘the worst of times.’ That is, the period when the country’s 1) public debt-to-GDP ratio had risen to above 600 per cent; 2) its macroeconomic fundamentals virtually collapsed; and 3) the most brutally imaginable structural adjustment programme was imposed on it in the form of the Economic Recovery Programme.
 The arguments in Guyana during that period of turmoil are eerily similar to those being repeatedly raised today in relation to the structural adjustment taking place in First World economies, especially Greece.
In this regard readers should note that intense debates took place over the roles of economic growth, expenditure stimulating policies, and equity as essential elements of structural adjustment measures, versus the then preferred deliberately impactful measures aimed at income, wealth, and livelihoods compression for the broad mass of the population in order to secure as the main economic outcome that countries are compelled to ‘live within their means.’
Public indebtedness record
The lesson which I drew from these debates is the need for all of us constantly to pay very close attention, not only to the evolution of Guyana’s public indebtedness, but its macroeconomic fundamentals as well.
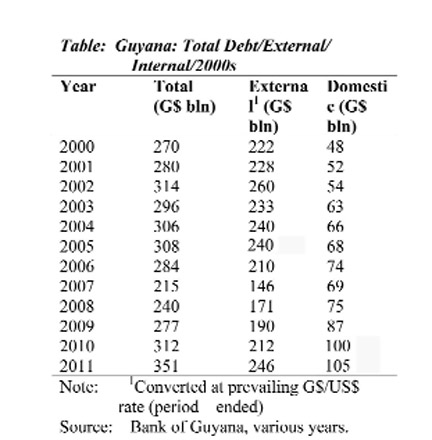
 The table below shows the values of public debt (total, domestic, and external) for the period of the 2000s. The table reveals several important trends.
First, as can be seen there the domestic debt has more than doubled during the 2000s (increasing from $48 billion in 2000 to 105 billion in 2011). There were increases in the domestic debt every year except 2007. In that year its value fell by about 6 per cent on the previous year.
Second, the data also reveal that the fluctuations in the value of total debt have been mainly due to movements in the external debt. Thus, external debt peaked in 2002 at $260 billion; but in 2011 it stood at $246 billion, which was about 10 per cent above the 2000 level of $222 billion. Further in 2012 the Ministry of Finance’s Half Year Report for that year reported a mid-year external debt of US$1,297 million as against US$1,205 million at the end of 2011!
External debt recorded its lowest levels of $146 billion in 2007 and $171 billion in 2008. By the end of 2011 this had increased by about 70 per cent to $246 million. The conclusion we can therefore safely draw from this table is that the 30 per cent rise in total public indebtedness in the 2000s (from $270 billion in 2000 to $351 billion at the end of 2011) has been mainly driven by increases in the domestic debt.
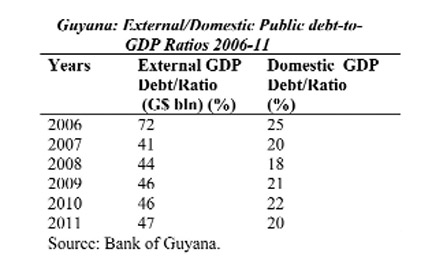
The resultant external and domestic debt-to-GDP ratios for the period of our coverage (2006 to 2011) are shown in the table below.
 There it clearly can be observed that, despite the faster growth of the domestic debt as a contributor to the debt burden, the domestic debt-to-GDP ratio has averaged 21 per cent for the years 2006-11. This compares with the higher ratio of just less than 50 per cent for the external debt-to-GDP over the same period.
Next week I shall continue with the third part of this discussion of Guyana’s public indebtedness since 2006.


