Culture of losses
GuySuCo is a state-owned corporation. Readers already have in their possession firm details of how deeply mired it is in what I have termed “a sea of losses and indebtedness” (annual losses of about $6 billion and outstanding debt of $90 billion in 2013). This circumstance makes the corporation effectively dependent on government bailouts and other forms of external relief to remain in operation. Its corporate governance has been enveloped in a pervasive culture of losses. This gives rise to the disrespect, eye-pass and other corporate iniquities it visits on the public at large because it believes government handouts are its entitlement. Citizens and their organizations, its employees, trade unions in the industry, and members of the National Assembly to whom GuySuCo is obligated to submit Annual Reports, find themselves in a situation where this public corporation has not submitted these statutorily required reports and Financial Statements for their scrutiny since 2009. Yet the corporation brazenly expects more and more bailout funding.
Astoundingly, this disrespect and eye-pass continue amidst repeated public calls for 1) a commission of inquiry into its operations, and 2) a National Sugar Task Force to prepare a long-term strategic plan for sugar (15-20 years).
Indicators
 At this point in the series on sugar, I shall resume examination of the three remaining performance measures. These constitute what sugar industry analysts term the productivity-based indicators, as will be gleaned from their descriptions below.
The first of these productivity- based measures is land (or natural resources) productivity. Here land refers to the harvested cane acreage, as well as its associated infrastructure (for example, drainage, irrigation, and access roads) required to cultivate and harvest the land.
The second is factory performance. This is interpreted as a proxy measure for the productivity of all the physical capital used in sugar production (including factory, as well as the machinery and other equipment utilized outside the factory).
The third is known in the industry as combined productivity. This measure combines land productivity and physical capital productivity. Reformulated this can be expressed as: 1) land productivity, defined as the yield of tonnes cane per hectare of harvested land (TC/HA) and 2) factory performance, defined as the tonnage of cane required to recover one tonne of sugar in the factory (TC/TS). Given 1 and 2, combined productivity is therefore the yield of sugar per hectare of harvested land (TS/HA).
Going back more than five decades ago to 1960, the yield of cane per hectare of harvested land was 94 tonnes. In comparison, for the two recent decades of the 1990s and 2000s the cane yield for estates’ cane has never exceeded 80.60 tonnes cane per hectare of harvested land.
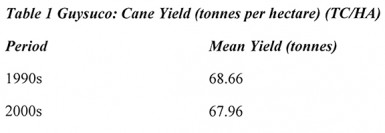
The information in Table 1 reveals that during the decade of the 1990s the mean (arithmetic average) yield of cane per hectare of harvested land was 68.66 tonnes, and for the 2000s the same measure was 67.96 tonnes per hectare of harvested land.

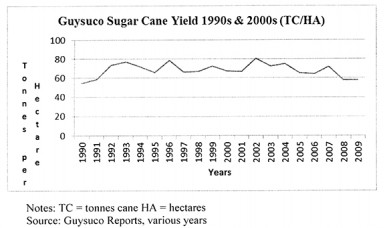
The difference between the means for the 1990s and 2000s is marginal. However, the annual variation of these yields was somewhat greater. Thus the range in yields for the 1990s ran from a low of 54.81 tonnes per hectare in 1990 to a high of 78.53 tonnes per hectare in 1996. For the 2000s the range in yields was similarly large running from a low of 57.50 tonnes per hectare in 2009 to a high of 80.60 in 2002. The mean deviations for the two decades of 1990s and 2000s were 6.14 and 6.86 respectively.
The graph below illustrates the annual variation in yield throughout the entire period of the 1990s and 2000s.

Private cane farmers
The data presented so far refer to sugar cane yields on GuySuCo estates. As readers are aware, private independent cane farmers also cultivate cane, which is sold to GuySuCo for processing on its estates factories. Currently that amount represents around 10-11 per cent of total sugar cane production. During the 1990s and 2000s this had been estimated slightly lower, at 8 to 9 per cent of total output. GuySuCo reports that 5,387 and 5,559 hectares of farmers cane were harvested in 2012 (unaudited) and 2013 (estimated) respectively. The amounts of cane harvested for those years were 303,515 and 274,287 tonnes respectively. The yields of tonne cane per hectare were therefore, 56.3 and 49.3 respectively.
The most recent overall, estates, and farmers estimates of sugar cane yields for 2012, 2013 and 2017 are shown in Table 2.
Table 2 GuySuCo Current Cane Yields and Forecast to 2017 (TC/HA)

Source: GuySuCo, 2013
That information reveals 1) Overall, during the early 2010s cane yields continued to be in the doldrums. 2) The forecasts to 2017 however, call for substantial improvements; increasing by more than a quarter between 2012 and 2017 and yet more between the shorter period of 2013 to 2017. As earlier indicated industry performance in 2013 was especially catastrophic. 3) The estates as a group reverse their performance after 2013 and are forecast to produce substantially better yields over the years leading up to 2017 (the intervening years are not shown in the table). By 2017, overall cane yield on the estates is forecast to rise by about 30 per cent.
Next week I will look at the current and forecast cane yields by individual estate, before turning to the analysis of factory performance. However, already we can see that the behaviour of the TC/HA performance measure reveals deep-seated agricultural stress in Guyana’s sugar industry.


