Introduction
In Guyana, inequality and poverty have a lot to do with people’s perception of these. Thus to the poor struggling masses, the perception of an inexorable rise in the flaunting opulence of the newly-rich amongst us leads not only to resentment, but also to feelings of societal marginalization and exclusion. How we may ask can it be otherwise, given the smallness of the country and its communities and the burgeoning rise of palatial residences and other ostentatious displays? Politics, economics, culture, ethnicity and ideology all contribute towards these depressing outcomes. This therefore makes 1) a focus on the gap between the poor and rich or the depth of poverty, and 2) establishing the severity of poverty in Guyana essential to my exploration of the theme inequality and poverty in Guyana. This topic is considered in today’s column.
Dilemma: poverty gap
 In concluding last week’s column I pointed out the dilemma which can occur as identical headcount measures of poverty (or the same percentage of persons living below the poverty line) could in practice represent quite different levels or degrees of poverty felt by the poor. This is because poor persons or households reveal how poor they are by the amount of additional income/consumption they require in order to be in command of resources equal to the value of the poverty line as established for the survey.
To cater for this circumstance, economists have introduced what is known as a poverty gap (PG) index. As the term implies this index measures the gap or depth of poverty as indicated in the survey. The index accompanies all reported results for survey-based measures of poverty, including in this instance those conducted for Guyana. The gap or depth of poverty as indicated by surveys is given by the distance, the income or consumption of each poor person or household’s actual income/consumption is from the value of the poverty line that the survey utilizes. As was indicated earlier, in Guyana the poverty line was established at US$1.25 for extreme poverty and US$1.75 for moderate poverty at 2006 prices.
Seen from the perspective of policy-makers the PG index gives an idea of the amount of resources, public and private (or percentage/share of poor people’s spending) that would be required to carry all those who are poor up to or above the income/or consumption level of the poverty line. Although the PG is useful in this regard policy-makers still need to be able to measure the severity of poverty. I turn to this next.
Dilemma: severity of poverty
The severity of poverty can be interpreted as the distribution of poverty among those who are classed as poor. In practice some poor persons will be poorer than other persons who are also classed as poor and, vice versa some will be less poor than others. In order to estimate the severity of poverty among those who are classed as poor, three economists (Foster, Greer, and Thorbecke) introduced a measure that has been named after them as the FGT2 index.
To obtain a measure of poverty severity these economists in essence recommend that the distance each person or household’s consumption/income is from the poverty line should be squared (or multiplied by itself) added together and calculated as a percentage of the poverty line. Thus if a person or household falls short of the poverty line by 10 dollars, this number is squared (that is, 10×10 = 100). And if they fall short by 100 dollars and the number is squared we get (100 x 100 =10000).
The effect of applying this procedure is that the further a person or household’s income/consumption is from the poverty line, the more weight it carries in the calculation of the FGT2. This means that more severe poverty is more reflected in the FGT measure than less severe poverty
Table 1 below shows both the poverty gap (PG) measure and the FGT2 measure for all Guyana and by geographic area obtained from the 2006 HIES survey. The left columns indicate extreme poverty and the columns to the right moderate poverty. The FGT2 measures are bracketed.
Source: GoG 2011, PRSP 2011-15, Table 2.4
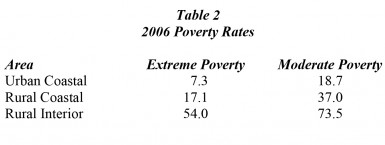
The table reveals what Guyanese would expect. Based on income/consumption measures the distribution of poverty in the Rural Interior areas is considerably more concentrated than anywhere else in the country; in fact about three times greater than the national average for both extreme and moderate poverty.
As I shall discuss more fully later, readers should bear in mind that the income/consumption approach to poverty measurement has been challenged. Nevertheless, this approach remains today the standard and commonest class of poverty measures; no other, including the UNDP’s various development indexes, have turned out to be more widely applied in serious investigations of this topic. Indeed as I shall observe other approaches effectively serve as complements to this class of poverty measures.
For the convenience of readers and in order to reinforce the geographic distribution of extreme and moderate poverty in Guyana I present these data separately in Table 2.
Source: Poverty Reduction Strategy Paper 2011-2015, GoG, 2011
Poverty by ethnicity
To wrap up the results Table 3 reports the data on poverty by ethnicity as revealed in the 2006 HIES survey results. These are compared to the World Bank’s survey results for 1992. As the table reveals the situation has improved for all ethnicities and the dispersion of outcomes considerably narrowed.
Source: Poverty Reduction Strategy Paper 2011-2015, GoG, 2011

