There is a lot of speculation taking place with respect to the likely voting behaviour of the population for the upcoming May 11 General Election. Many are forced to speculate because we do not have regular independent surveys of voting behaviour. It is disappointing that no one from Faculty of Social Sciences at the University of Guyana conducts regular surveys of the population’s social, economic and political sentiments. Academics have a duty to society and should not have to wait until a patron-client opportunity opens up from IDB or one of the other foreign agencies before research gets done.
For starters the government refuses to release the ethnic breakdown of the population, so anyone doing the surveys will have some degree of uncertainty regarding the sample stratification. Nevertheless, last year – 2014 – the Americas-Barometer surveys were conducted as part of the Latin American Public Opinion Project (LAPOP). The survey sampled 1558 Guyanese and was conducted from June 4 to July 12, 2014. LAPOP is interested in many variables pertaining to democratic culture and stability in Guyana, Caribbean and Latin America. The data set is rich, but requires some digging. One of the variables they captured is the voting preference of Guyanese.
 Those surveyed in 2014 were asked how they voted in the 2011 election and how they are likely to vote in a future election. Let us first consider how they are likely to vote in the future election: (i) 18.3% said they would not vote; (ii) 33.9% indicated a preference for the incumbent PPP; (iii) 46.1% said they would vote for a party different from the current administration; and (iv) 1.7% would deliberately spoil their ballots. One might be tempted to agonize over this sample as it was done outside of election season in the middle of 2014. However, we have to work with what we have since no one is conducting credible surveys on a regular basis.
Let is now consider how the survey of 1558 individuals said they voted in in 2011. The percentages are: (i) 45.9% said they voted for Donald Ramotar and PPP; (ii) 42% indicated they voted for APNU under David Granger; (iii) 11.1% said they voted for AFC under Khemraj Ramjattan; and (iv) 1.9% voted for other candidate or deliberately spoiled their ballot. These numbers are fairly close to the actual voting outcomes of the November 2011 election; hence, one can have some degree of confidence in the LAOP survey. The actual result of the 2011 election was as follows: PPP (48.6%), APNU (40.8%) and AFC (10.3%). Therefore, we can conclude that the LAPOP sample is under predicting the PPP’s vote by 2.7%, over predicting APNU’s by 1.2% and over predicting the AFC’s performance by 0.8%.
However, in 2012 another LAPOP survey was conducted over the period January 23 to February 28. That survey of 1529 people asked how they voted in the November 2011 general election. They indicated 36.4% for PPP, 44.3% for APNU and 18.4% for AFC. It is obvious the 2012 survey was way more out of sync with the official results of the 2011 election. Was this a mere sampling error? Or does it reflect something more sinister? In addition, the 2012 survey shows a low level of legitimacy for the GECOM; hence all the stakeholders will have to be vigilant on May 11.
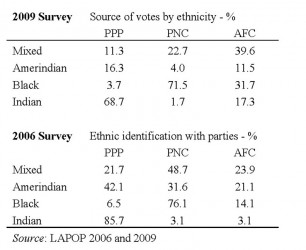
Several observers have noted that the sum of the two parts – the separate performance of AFC and APNU – will not be equal to the amount received in a pre-election alliance. The implicit assumption here is that East Indians in the main are unrepentant racists. Of course, the Guyana Times posse places a high value on race-based voting because East Indians have the numerical advantage. However, the data resoundingly reject the notion that all East Indians vote for the PPP. We have raised the point in previous columns that the voting pattern reflects strategic ethnic voting, which is a manifestation of the economic ethnic security dilemmas that go back to a period after emancipation. The 2014 data released on LAPOP’s website do not give the voting preference by ethnic group. For this we have to turn to the data from the 2009 and 2006 surveys. These are summarized in Table 1.
 Table 1 Source of votes and party identification by ethnicity
In 2006 85.7% East Indians identify with the PPP, while 76.1% African Guyanese identify with PNC. In 2006 East Indians identify with PNC and AFC equally for a combined total of 6.2%. African Guyanese identify to a greater degree with a party other than the PNC. In 2006 14.1 % African Guyanese identify with the AFC and 6.5% with the PPP. Still, reflecting the strategic nature of the vote, 76.1% identifies with the PNC.
By 2009 the trend is in favour of an emerging independent class of voters. A substantial 19% of East Indians now support a party except the PPP. Their support of the PPP declined to 68.7%. African Guyanese support for the PNC also declined slightly to 71.5%, while 35.4% prefers another party. Mixed voters have also demonstrated less support for both the PPP and PNC, increasing substantially their support for the AFC. The survey suggests that Amerindians are less identified with the three main parties, which is a curious trend. We would need data beyond 2009 to see whether this continues.
These hopeful trends are suggestive of an emerging middle range of voters who might possibly swing the election, thereby resulting in regular democratic turnover. In my opinion, democratic turnover will be the most important political development since 1953. I hope LAPOP will make available the ethnic voting trends after 2009. The class of swing voters will be valuable for the entire society and they will discipline the political leaders. These independent voters play a crucial role in democracy elsewhere in the Caribbean, perhaps providing the main reason why the Prime Minister of Trinidad and Tobago was forced to fire several ministers. In Guyana the incumbent PPP government does not have an incentive to govern progressively because a previous reliable ethnic vote bank guaranteed victory. Hence, no minister ever gets fired in Guyana no matter how egregious the offence.
We will continue to examine some of the rich insights buried in the LAPOP surveys.
Comments: [email protected]


