Introduction
Last week’s column identified ten leading considerations which are responsible for the high standing of Guyana in the world of forests. This standing is well described in Guyana’s indicated nationally determined contribution (INDC), submitted under the December 2015, Paris Agreement of the United Nations Framework Convention on Climate Change, (UNFCCC). Guyana’s INDC projects strict curbs to its greenhouse gas emissions (GHG), particularly carbon dioxide (CO2).
 An earlier column (April 24, 2016), had highlighted in a Schedule, based on data from Alder and Kuijk (2009), Guyana’s 1) ‘historic’ rate of deforestation (0.4 per cent); 2) annual average number of hectares deforested (62.6 thousand); 3) average net carbon loss per hectare, and thus annual carbon dioxide emissions (40.1 mlntCO2); and 4) estimated market value of these carbon emissions, based on a 2009 carbon price of US$20 per ton carbon dioxide equivalent. That Schedule (1) is reproduced below, with an updated estimate of the carbon market value, after allowance is made for inflation on the 2009 US$ carbon market value (11 per cent).
In that estimate, Guyana’s deforestation rate is termed the ‘historic rate’. Certainly no serious analyst would now expect that rate to hold into even the medium term. Before addressing this topic further, readers should be reminded that the carbon market value of annual emissions of CO2 from Guyana’s forests, is quite large; in the region of US$890 million, at the inflation adjusted price of US$ 20 in 2009.
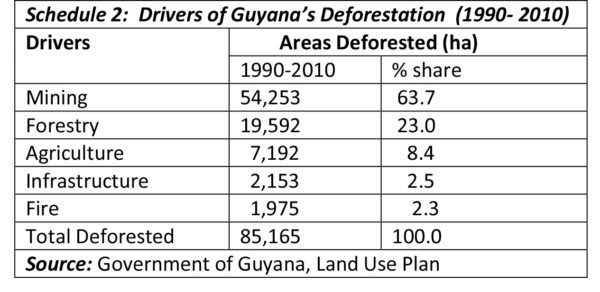
To arrive at plausible rates of future deforestation, it is necessary to recall the main drivers of Guyana’s deforestation. Schedule 2 below, reproduced from an earlier column (April 10, 2016) shows the leading drivers of deforestation for the period 1990 to 2010. There it is evident that, mining (at nearly 64 percent) is easily the leading driver; followed by the substantially lower forestry (23 per cent). Agriculture, infrastructure, and forest fires are all below ten per cent, with forest fires only 2.3 per cent.
Land use change
Similar to elsewhere, land use change in Guyana’s forests typically results from human activity. This can occur both directly, (as in the case of mining, agriculture, and infrastructure) and indirectly, when human activity triggers/initiates endogenous ecological processes in the forest ecosystem; for example, forest fires, nutrient loss, and disease.
It is also important for readers to be aware that human activity drives deforestation only in so far as other land uses for the forests yield greater marginal revenue than the forests do, if they are harvested with forest conservation while leaving the forests standing, as the sole intent.
Forest research in Guyana portrays two crucial variables at the base of deforestation. One is population pressure. This expresses itself in the need to provide additional settlements, jobs, and other ways of securing livelihoods. While Guyana’s population growth, over recent decades, has been quite low, this was enough to put pressure on the development of these. The second crucial variable is income. This is best reflected in the rates of national income (GDP) growth. Here again, while the historic rates of GDP growth have been quite low, mining, agriculture and infrastructure have nevertheless shown significant expansion.
Population and income growth
These two variables, population and income, can be combined and expressed as per person or per capita GDP. The behaviour of this can then be related to the observed rates of deforestation, in order to discern the numerical relation between the two. Alder and Kuijk (2009) did such an exercise. First, they obtained a long term rate of per person GDP growth, (roughly from 1969 to 2008) of 1.06 per cent per annum. Second, when this is compared to the historic rate of deforestation of 0.4 per cent; the ratio between the two rates is 2.65; that is,.
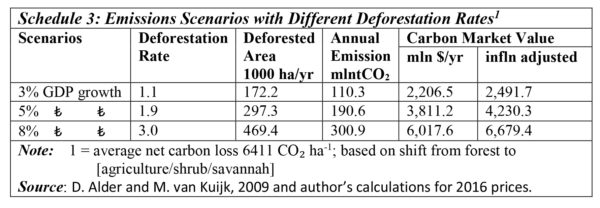
With this observed relation, various growth rates can easily be projected into the future, and the likely deforestation rate estimated, by using the ratio of 2.65. While any number of growth rates is theoretically possible, the authors chose three rates which they believe would cover the likely range. These are 3, 5 and 8 per cent per annum respectively. Based on the ratio of 2.65, therefore, we have 3.0/2.65; 5.0/2.65; 8.0/2.65, which give deforestation rates of 1.1; 1.9; and 3.0, respectively. These results are shown in Schedule 3 below.
Next week I take up important issues which lie behind this formulation. Such analysis will lead to one of the most celebrated (and I believe contentious) theoretical constructs in the world of forests; that is ‘forests transition theory’. In other words: does the correlation between economic growth and deforestation, uniquely indicate a relation of cause and effect?


