Introduction
Today’s column focuses on economic data for the forest sector, other than those derived from Guyana’s National Accounts, which have been already introduced. This is done in order to offer a  wider perspective of the extractive forest sub-sector’s performance. Some readers have correctly queried whether the macroeconomic national accounts information supports that obtained from a more microeconomic assessment of sector performance. This effort will occupy today’s column, as well as the two following. The data presented, will refer to employment, production, exports, and prices. I shall commence with employment in the next section.
Employment
Thankfully, the Guyana Forestry Commission (GFC) has been for several years providing annual estimates of employment levels in the forest sub-sector. Usually, these estimates are further broken down into six areas of employment: logging, sawmilling, timber dealerships, plywood & veneers, manicole palm, and “other”. Other includes such items as craft, furniture, building components, charcoal, utensils, ornaments, fuelwood and conservation. Readers are advised upfront, that I am unable to vouch for the accuracy of these estimates or indeed any other forest employment figures cited in these columns.
However, the GFC employment data indicate two noteworthy features. One is, when the data they have provided for the past decade are compared with those available for the early to mid-1990s period, which are obtained from other sources, the employment level in the forest sector is revealed to have grown substantially – more than doubling since then. Thus, the National Development Strategy Version II (NDS), 2001 had indicated total employment in the forest sector at 11,410 persons in 1992. For 1996 and 1997 the NDS cited 15,275 and 16,000 persons, respectively. In 1998 it reported a significant spike in the numbers; the total rose to 19,000 persons.
The second significant feature of the GFC employment data is that, having reported these on a regular annual basis, there is a distinct impression among those using these data that there is less guesswork in them than in the earlier NDS estimates. The GFC reveals that over the past decade, the employment level of 2006 was approximately the same as it was in 2015. Further, over the course of this entire decade, the employment level had declined from a peak of 27,027 persons in 2007 to a low of 21,173 persons in 2012.
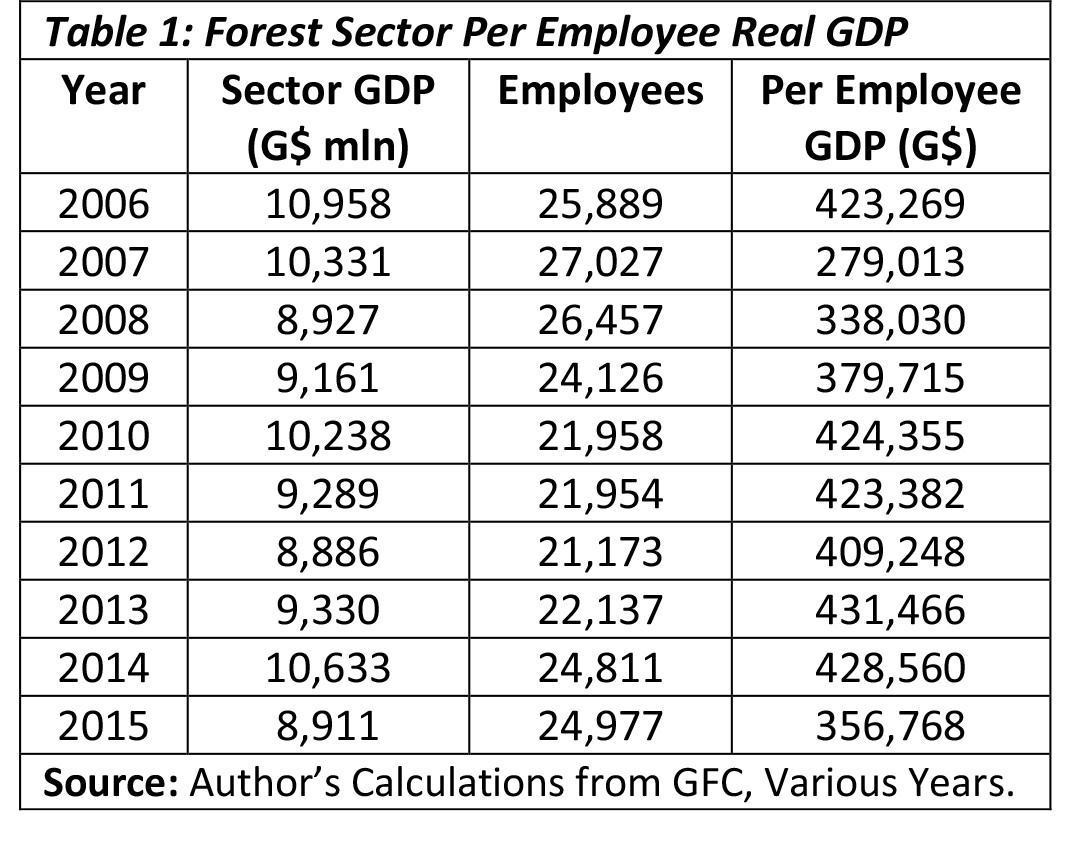
Indeed, if we divide the decade into two five-year periods, one further observes that, for the first period (2006-2010), employment averaged 25,093 persons; and for the second period (2011-2015), this average had declined to 22,010 persons. These data are shown in Table 1. Attentive readers might observe from the time series, that 2010-2013 was the period where most of the reported decline took place; the average for those years was only 21,805 employees. This is an amount that is below the 2011-2015 average level.
Readers would have also noted that in presenting the 2006-2015 time series, Table 1 has combined annual numbers of total forest sector employees and annual real values (2006 prices) of forest sector GDP. This generates the per employee/worker real forest sector GDP, during the decade. This is a useful, if indirect indicator of per worker productivity.
From this productivity perspective, the data indicates the following occurrences over the decade: 1) the lowest per worker real GDP produced occurred in 2007 (G$279,013) and the highest occurred in 2013 (G$431,466). The range for the decade was over G$150,000; above 50 per cent of the lowest output. This reflects two considerations, namely, the variability of the sector’s contributions to real value-added GDP, as well as significant employment swings. Attentive readers would have further observed that, for six of the ten years cited in the table, annual per worker real GDP was greater than G$409,000. And for the remaining four years the average obtained was about 15 per cent lower.
Broken-down data
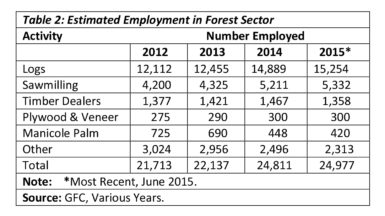
Looking at Table 2, this reveals for the most recent four years (2012-15) the employment data broken down by the activities cited earlier. The information shows that logging is the dominant source of forest employment, accounting for about 60 per cent of employment over the most recent four-year period (2012-15). Logging was followed by sawmilling, which employed about 20 per cent of the total. Significantly, the “other” category combined with the production of manicole palm provided the third largest employment activity. This however declined by nearly 30 per cent between 2012 and 2015.
When these data are compared to those which the NDS had supplied for the early to mid-1990s, the expansion of employment in logging is revealed as quite striking. Furthermore, at the earlier time, the NDS had estimated logging to account for just about one-half the employment in forestry with sawmilling and plywood accounting for about 4-5 per cent each.
Conclusion
The employment performance indicated in today’s column is consistent with the poor economic returns of the forest sector, as revealed in its assessment in terms of Guyana’s national accounts.
Next week I shall continue to comment on the other microeconomic data referred to above.


