Introduction
 Based on the medium and long-term outlook of the world’s energy market, today’s column introduces two further policy lessons to guide Guyana’s planning for future oil and gas production and export. These are 1) the anticipated fuels mix over the long-term (to 2040); and 2) the probable global market impact of a stricter regimen for carbon emissions control.
Energy Mix (2040)
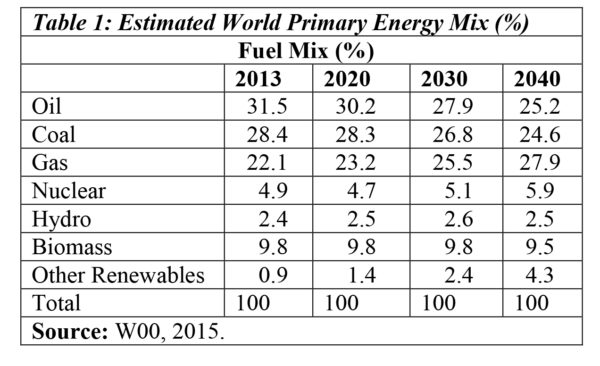
Table 1 presents the OPEC’s, World Oil Outlook, (WOO), 2015 estimates of the global primary energy mix (in per cent) by 2040. Several features stand out. First, the share of fossil fuels (gas, oil and coal) still remains very high (78 per cent) by 2040; listed in descending order of magnitude. This share is four per cent lower than it was in 2013.
The fossil fuels decline is largely attributed to resistance against their high levels of carbon emissions. Both coal and oil are projected to be losers over the long run. Thus oil’s share is expected to fall from 31.5 per cent in 2013, to 25.2 per cent by 2040. Similarly, coal declines from 28.4 per cent to 24.6 per cent over the same period. Natural gas however, is a clear winner. Its share increases from 22.1 per cent in 2013 to 27.9 per cent by 2040.
Second, renewables (biomass, ‘other’, and hydro) are expected to total 16.3 per cent by 2040. Their individual shares are 9.5, 4.3 and 2.5 per cent, respectively. These compare with a group share of 13.1 per cent, and respective shares of 9.8, 2.4 and 0.9 in 2013. ‘Other’ mainly comprises wind, solar, and geothermal sources of energy. To reach a group share of 4.3 per cent of the global market by 2040, ‘Other’ would have to grow at the high annual rate of 7.6 per cent.
As we consider the likely production levels for Guyana’s oil and gas later, it will become clearer to readers then that, over the long-term, their performance will not fundamentally or structurally change the dynamics of the global energy market. Guyana’s price-taker role in global extractive industries, will likely remain.
The long run fuels mix
It has been widely observed that, on the energy supply side, technological innovations have increased the potential for new forms of energy. The issue therefore, is: will their demand match the pace of their supply? Significantly, in introducing BP’s 2016 World Energy Review (WER), the BP Group’s Chief Economist shrewdly observes: “the key lesson from history is that it takes considerable time for new forms of energy to penetrate the global market” (S Dale, 2016).
This assessment conforms to the medium and long-term estimations provided in OPEC’s World Oil Outlook (WOO), 2015, revealed in Table 1.
Empirical
More pertinently, Dale has offered empirical information in support of this observation. Thus he points out: “if we started the clock at the point at which a new fuel captures one percent of the world’s primary energy demand”, the following is observed: 1) oil took more than 40 years to reach 10 per cent of global primary energy demand; 2) natural gas took more than 50 years to reach a share of 8 per cent; and 3) despite striking growth rates, renewable energies remain “broadly comparable to those recorded by other energies at the same early stage of development”. Indeed, renewable energy’s expansion path in the world energy market is similar to that of nuclear energy; and, as readers are aware, for a variety of reasons, nuclear energy’s penetration in the world’s energy market “has plateaued relatively quickly”.
Clearly, many complex considerations account for such varied outcomes. Thus, in the case of nuclear energy the pace of “learning and breakthroughs in techniques” has slowed, thereby contributing to rising unit costs. As a rule, the penetration rate for all fuels in the global energy market is mainly a function of the time it takes to mobilize the required resources (including funding) needed to capitalize industries at the scale new energy requires. However, because of the high capital-intensity of energy systems together with the long life of these assets, this circumstance puts a brake on the speed with which any new form of energy can penetrate the world market.
Despite the above, renewable forms of energy are likely to penetrate the market faster than any other fuel source in modern history. Nevertheless, readers should be cautioned that the projections carried in Table 1 reveal the share of renewable energy in global primary power only reaching 8 per cent, two and a half decades into the future.
Fourth policy lesson
The fourth and final policy lesson I shall introduce for now is that present estimated long-run global real GDP growth indicates a significant decline in the carbon intensity of GDP; a declining annual rate of carbon emissions per unit of GDP of around 2.8 per cent is expected (WER, 2016). Further, the WER, 2016 advises: “in the past 50 years, there have been only two other occasions in which carbon intensity of GDP has fallen by as much, and these were the years of rapidly rising oil prices”.
From my standpoint, the two most significant aspects of carbon emissions policy are 1) the Paris Climate Agreement (2015), which requires global GDP carbon intensity to fall at an average rate near 5.5 per cent, over the next two decades; and 2) several of the world’s largest oil and gas companies have declared support for this Paris Agreement, 2015, (COP 21) target for emissions reduction, including BP Group, ENI, PEMEV, Reliance Industries, Repsol, Saudi Aramco, Shell, Statoil and Total.


