Within hours of the publication of my last Sunday’s Stabroek column, where I had indicated my intention to write a “three-part review of Open Oil’s reported financial modeling exercise of Guyana’s 2016 PSA”, its Founder and Author of the exercise wrote to the Stabroek News Editor “to correct some inaccuracies” (letter published, Monday, May 7, 2018). Not to be distracted from my original aim, I will provide a detailed response to these alleged “inaccuracies”, in the last part of my “three-part review”. Today I shall concentrate on wrapping-up the first part of the review; which is, the “description of the key features and assumptions” behind the modeling exercise.
Meanwhile, the inaccuracies that were identified in the letter, include: 1) “Open Oil did not develop the FAST standard” 2) Open Oil is not an NGO, but an incorporated German Company 3) the claim that it offers “unique specialized training” is inaccurate 4) the claim also that it “offers its services for sale as an equal opportunity consulting group is a phrase it has not used” 5) further, the claim that “the model is focused on Liza I as the first field” is inaccurate 6) and finally, the use of the “February long-term forecast price by the EIA” is inaccurate. I shall fully address each of these in turn in Part 3 of the three-part review.
Today’s Column Focus
Today’s column wraps-up Part 1 of the evaluation of Open Oil’s FAST financial modeling of Guyana’s 2016 PSA. The basic aim is to summarize the key features and assumptions inputted into the model exercise.
Those features include: 1) Liza I represents Guyana’s first oil and gas extraction endeavour, thereby making Guyana an “early stage” producer 2) operating in a “frontier” region 3) located offshore 4) exploiting its first “significant find” with considerable “potential”, while 5) facing significant political, geo-strategic, technical, & technological challenges, including environmental ones.
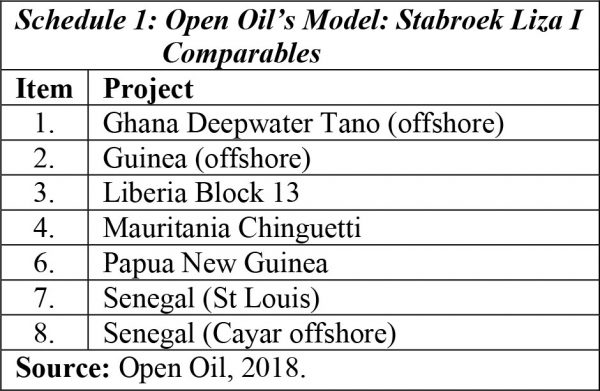
These features have been identified largely with the intent of locating the modeling exercise results among those from a group of comparable African and Asian oil-producing developing countries. These countries are listed in Schedule 1. I readily admit that, I am in no position to assess the suitability of this group of comparators, but I am quite willing to accept the list at face value, based on Open Oil’s reputation.
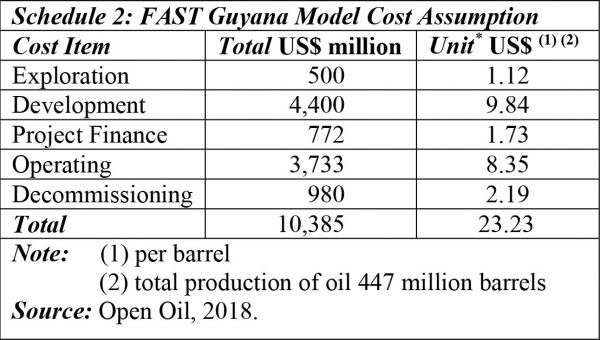
Source: Open Oil, 2018.Those total cost figures shown last week came from the modeling exercise, which claims they have been obtained from public statements made by Exxon and its partners. The figures are summarized in Schedule 2, along with their per unit values.
The purpose for the per unit citation is to draw comparisons (for readers’ convenience) with recent data on the per barrel breakdown of cash cost to produce a barrel of oil from a sample of 12 different jurisdictions. The data on operating costs provided in the Schedule below, are estimated for both fixed and variable cost. Fixed costs are estimated “at US$50 million a year fixed”. And, variable costs are estimated “at US$6 variable per barrel”. Both estimates, the exercise reports are “in line with estimates in similar projects”.
The barrel breakdown data were obtained from Rystad Energy, 2018 and are from a sample of 12 countries. These data show per barrel average cash cost ranged from less than US$10 (Saudi Arabia) to more than four times as large US$40 (United Kingdom), (March 2016). However, as the modeling exercise report notes “Estimates for the Brent benchmark oil have been used since no information is available on a premium or discount for Stabroek crude”.
Finally, the Rystad data also reveal that five of the sampled countries (Canada, Venezuela, Nigeria, Brazil and the United Kingdom) had cash costs per barrel that exceeded Liza I modeled per barrel cost of US$23.23. Five countries had a cash cost less than US$20 (Indonesia, Russia, Iraq, Iran and Saudi Arabia).
Note: (1) per barrel (2) total production of oil 447 million barrelsSource: Open Oil, 2018.
Finally, last week’s information makes clear the exercise on Guyana’s Liza I has been effectively modeled for a period of four decades 1999-2040. The first two decades covered the lease, appraisal, exploration, and development phases; and, the last two decades (still to come), cover the production and de-commissioning phases.
Model’s Revenue Flows
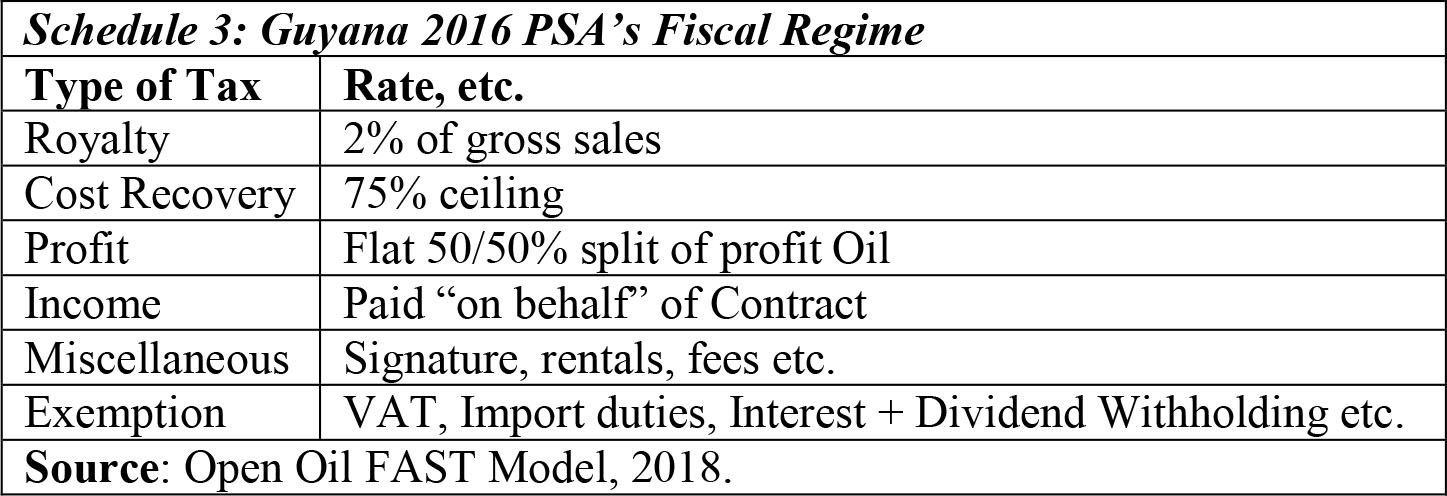
Based on 1) the Liza I target of 450 million barrels of recoverable oil 2) the production profile as had been indicated last week, including the ramp-up of production to plateauing and subsequent decline leading into decommissioning 3) the use of the Brent benchmark price 4) and the costs as revealed; the model simplifies the fiscal regime into six core elements. These elements are 1) the royalty placed on gross sales (two percent) 2) cost recovery (with a ceiling of 75 percent) 3) profit petroleum (based on 50/50 percent split) 4) income tax (which is paid out of Government’s profit of 50 percent, on behalf of Exxon and partners) 5) miscellaneous (which includes the one-off signature bonus, rentals, fees etc.) and finally 6) a range of exemptions, including, VAT, Import duties, Interest and Dividends, Withholding Tax. These are displayed in Schedule 3 just as it is in the report on the financial modelling exercise.
Conclusion
Next week, I focus on Part 2 of this review; namely, the results. After that, I conclude with a critique. In order to accomplish this task, I may have to extend the number of columns by one or two. I shall advise readers as I proceed.
