 The main monetary policy target of the country’s central bank, Bank of Guyana, is the exchange rate. The central bank fine-tunes its sales of Treasury bills and at times uses some form of moral suasion to achieve its desired exchange rate target. Since 2004 the central bank has done a remarkable job stabilizing the exchange rate in spite of the political climate. The monetary policy makers can only do so much to achieve the goal of macroeconomic stability, of which the exchange rate with respect to the US$ is the primary target.
Last week a main commercial bank was selling one US$ for 217 Guyana dollars. This is just one observation, however. The Bank of Guyana would usually take the average of all the cambios and commercial banks. The average, from my cursory observation, is closer to G$213 to one US$. This represents a devaluation from the relative stability of earlier years. The average rate was exactly G$199.99 to one US$ in 2004. Since then there has been a creeping devaluation of the Guyana dollar. The intensity of the devaluation seems to have picked up since mid-2016.
The government claims that Caribbean nationals are busy taking out US$ from Guyana. The unwinding of the narco-economy is given as another reason. I find neither of these convincing explanation for the creeping devaluation. It is not that the government has done nothing to clamp down on narco trafficking. The Granger administration certainly has. However, this has nothing to do with the pressure evident in the foreign exchange market these days.
The seeds of the current situation were planted a long time ago. The target requires that the BOG holds ample foreign exchange reserves, particularly in relation to the commercial banking sector. The level of foreign or international reserves sends a signal to the FX market that the central bank can achieve its target. The credibility of the signal declines if the BOG’s net foreign reserves decrease. If there is not enough foreign exchange reserves, the market would expect a devaluation.
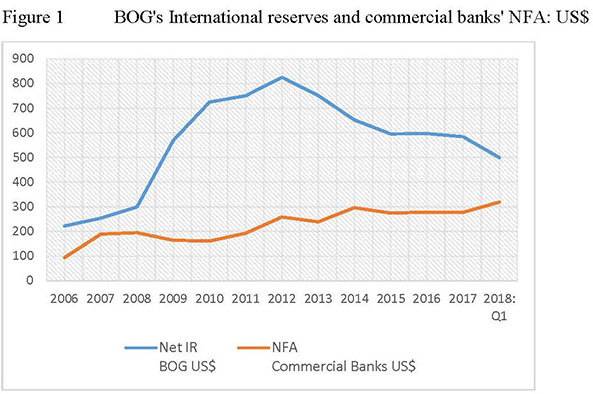
If we look at the period 2006 to first quarter of 2018, we would observe that the highest level of net international reserves of the Bank of Guyana was US$825 million in 2012. This can be seen in Figure 1. The year 2012 was a turning point for the Guyanese economy since other macroeconomic variables also show similar downturn starting immediately after the November 2011 general election. As at the end of 2017, the net international reserves of the central bank was US$584 million. By the end of first quarter 2018, the last period of publicly available data, net foreign reserves amounted to US$499 million.
The cambios and banks, therefore, have started to adjust the exchange rate in line with their expectation of devaluation. One factor which is serving to curtail a more rapid devaluation is the targeting of the spread between the buying and selling rates of the bank and non-bank cambios. This smart policy was introduced by the Bank of Guyana about eighteen months ago. The market is expected to maintain a spread of G$3 between the buying and selling rates. This helps to curb rapid speculation and most likely has contributed to the creeping instead of a more precipitous devaluation. The monetary authority has therefore bought some more time for the political class to get its act together.
In spite of the loss of foreign reserves by the central bank, the commercial banks have gradually increased their share of net foreign reserves (or assets). Since 2006, there has been a gradual increase in the net foreign assets (NFA) of commercial banks, which need foreign currencies of their own to serve their customers involved in foreign trade and money flows. As at the end of first quarter 2018, commercial banks increased their holdings of NFAs as the BOG’s number took a nose dive.
The general trend of net IR of Bank of Guyana and NFA of commercial banks from 2006 to 2018:Q1 is illustrated by Figure 1. The upper line shows the decline in BOG’s international reserves since the 2012 peak of US$825 million. However, there is a clear long-term upward trend, in spite of some fluctuations, in the NFA of commercial banks.
Figure 1 illustrates the important problem of the gradual loss of control of the foreign exchange market by the central bank. This loss of control comes from the decentralized sources of foreign exchange on which the BOG depends. In the old days, GuySuCo, the bauxite companies and other state-owned companies provided a reliable source of foreign currencies to the central bank. It seems as though privatization was never done with a strategic vision. GuySuCo’s role in providing foreign currencies for meeting the target was never appreciated.
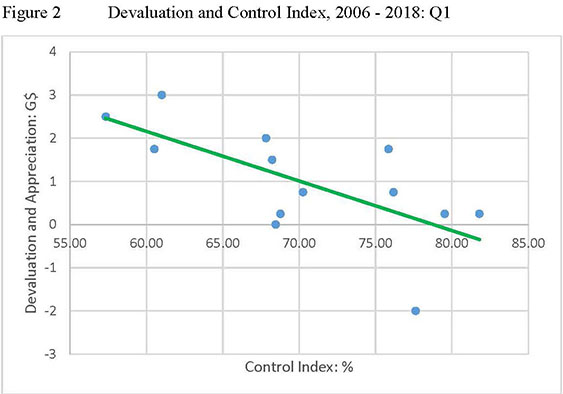
I can create an informal control index defined as the percentage of total foreign reserves accounted for by the Bank of Guyana. As noted earlier, foreign reserves are held by commercial banks and BOG. As the BOG’s share increases we can say the central bank has more credibility and growing control of the market. On the other hand, a decline in the BOG’s percentage share indicates a decrease in the control of the market. Therefore, 0% indicates no control and 100% total control of the market. We should expect devaluation to result as the BOG loses control of the market and appreciation or revaluation as the index value increases.
This is exactly what is evident in the data from 2006 to first quarter 2018. Figure 2 shows the control index (in %) on the horizontal axis and the devaluation and revaluation on the vertical axis. The devaluation or revaluation (in G$) is just the change in the exchange rate from one year to the next. A positive change indicates a devaluation and a negative change a revaluation of the currency. As can be seen, there was just a single revaluation in 2009; hence the negative number. In 2015 there was no change in the average rate; hence the zero.
There were however creeping devaluations in all the other years. It is clear from Figure 2 that the size of the devaluation increases as the central bank’s share in total foreign reserves decreases. In other words, devaluations are larger as the control of the market wanes. The loss of control is indicated by a movement towards 0% and growing control a movement towards the right to 100%. The negative trend line indicates the overall pattern in the data: as the central bank gains control there is smaller devaluation and the movement towards appreciation.
We will continue this discussion in the next column.
Comments: tkhemraj@ncf.edu


