Last week’s column indicated that, based on three published estimates of Guyana Government Take, the Strategic Road Map is premised on the country receiving the average of these estimates – 55 percent. Lacking reliable information on the life-cycle of the intended wells supplying crude, I am not in a position to offer any improved indication for that fiscal metric. The “rule-of-thumb” applied in the petroleum industry is that the “life-span of onshore oil and gas fields (from first oil to abandonment) ranges from 15 to 30 years.” For deepwater fields the rule-of-thumb is a range around 5 to 10 years; one-third that of onshore fields. The rationale for this difference is the high exploration and extraction costs of deepwater wells. Similar information on ultra-deepwater fields (as are some in Guyana) is scant. Experienced analysts do not offer/predict routinely a “reliable” rule-of-thumb for these.
Rystad Energy (2018) has supplied one of the three estimates of Guyana Government Take. It has also reported that “on average Government Take for all present offshore projects is around 75 percent.” Predictably, this is higher for major producing countries but lower for recently opened up frontier countries like Guyana. Here, “the range is 45 to 70 percent.” This range reinforces how sensible is the “guesstimate,” which I apply of 55 percent for Guyana’s Government Take.
Furthermore, whatever improvement in this Take occurs over time, this is not taken into consideration. Of note, such increase is likely to occur if, as expected, the Authorities succeed in improving their monitoring, reviewing, and verification (MRV) of existing Production Sharing Agreements (PSAs) and any new ones.
Massive Potential
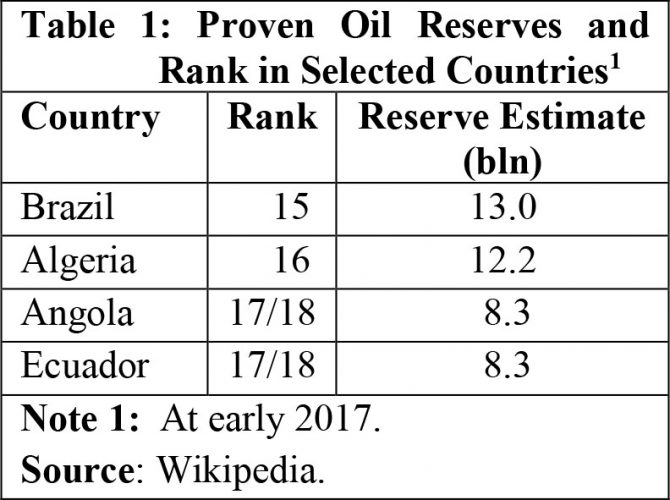
As observed in the conclusion to last week’s column, while I have adopted a conservative stance as regards Guyana Government Take, I shall continue to be strongly “bullish” on Guyana’s petroleum reserves potential. Upfront, therefore, I declare, based on my long-term strategic assessment of Guyana’s potential oil reserves and consequent production from its reservoirs, an amount of 13 to 15 billion barrels of oil equivalent will be applied to the Road Map. How massive this prediction is, can be readily gleaned from the global ranking of countries with proven oil reserves. Wikipedia indicates that, at the beginning of 2017, Brazil was ranked 15th globally, with a holding of 13.0 billion barrels of oil reserves. Algeria was ranked 16, with a holding of 12.2 billion barrels. And, Angola and Ecuador, were ranked 17/18, as each had exactly 8.3 billion barrels of oil equivalent. These data are displayed in Table 1 below.
Going forward, I shall provide justification for my estimate of Guyana’s long-term potential being as high as 13 to 15 billion barrels of oil equivalent for the rest of today’s and next week’s column. Before turning to this task, I draw readers’ attention to two pertinent observations. The first is to direct attention to the present level of petroleum reserves estimates, which is offered by the two main Contractors’ that are scheduled to begin production in the short-term (1 to 3 years). There is Exxon and partners, whose reported estimate in various press releases and media statements is for an amount of 6 billion barrels plus. Second, there is Eco Atlantic’s, which indicates approximately 3 billion barrels. Exxon’s estimate is derived from a steady stream of announcements on their “Finds” and scheduled dates for production. Eco Atlantic is derived from company announcements, reflecting both internal company estimation and those provided through a Competent Persons Report (CPR), which was commissioned from Gustavson and Associates, Canada. When combined with Exxon’s, this yields a total of 9+ billion barrels of oil.
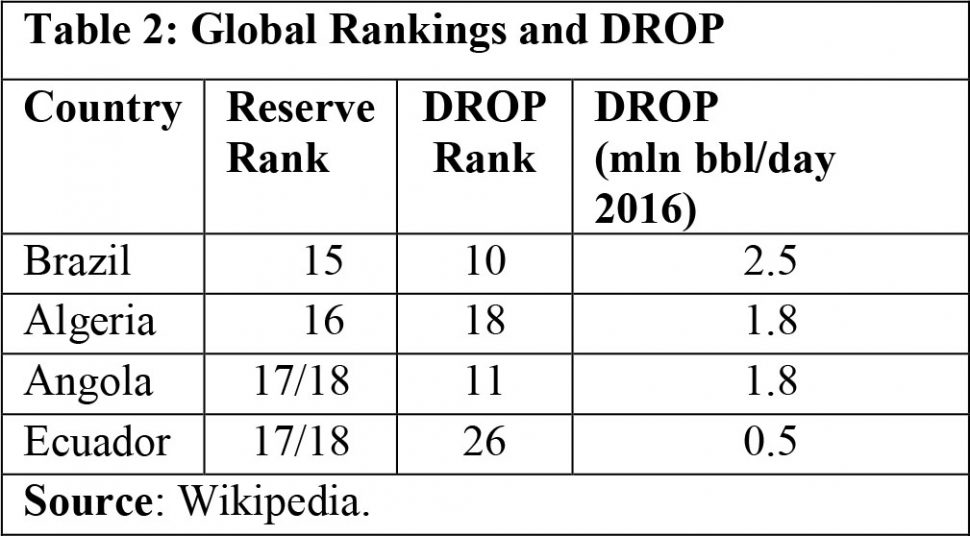
The second observation is that in seeking to arrive at an estimate of Guyana’s likely daily rate of production (DROP), I use a simple, indirect method. This method infers Guyana’s likely DROP from reported DROPs for the countries ranked 15 to 18 in terms of petroleum reserves holdings (See Table 1). These four countries DROPs are respectively ranked globally as 10, 18, 11, and 26. These details are shown in Table 2.
The indicated DROP for these four countries ranges from 2.5 million barrels a day (Brazil) down to 0.5 million barrels a day, Ecuador (542 thousand barrels a day). The range is 2 million barrels and the mean is 1.5 million barrels per day. If we removed Ecuador’s DROP, which is below the current projection of 750,000 barrels a day for Exxon alone, the mean is then 1.9 million.
There is an obvious mis-match between reserve holdings and production rank. The data do, however provide for that range of DROP, which Guyana should be able to attain at maximum ramp-up. I shall use this figure as the basis for estimating Guyana’s petroleum export earnings at full ramp-up. While the mean for all four countries is 1.5 million barrels of oil, for the three excluding Ecuador, which is below Guyana’s projected DROP, it is 1.8 million barrels. Readers would note this estimation does not relate to natural gas. I project that at maximum ramp-up therefore Guyana could reasonably be expected to produce between 1.5 million and 2.5 million barrels per day!
Justification
In what is to follow next week, I shall provide justification for both estimated reserves and estimated DROP for Guyana. The justification will follow four principal lines of argument. First, I recommend this estimation based on an appreciation of Guyana’s petroleum geology. I had covered this item partially, in my earlier articles when referring to the geological principle of the “Atlantic mirror image.” Second, I shall introduce what I consider are authoritative estimates of Guyana’s potentially “recoverable resources”. These are provided by United States’ Geological Assessments during the 2000s. Third, I rely on a battery of comments and features on Guyana’s petroleum potential, which are sourced from energy research and analysts firms. These similarly demonstrate a “bullish” outlook as mine. Fourth, justification, I argue is also reflected in Guyana’s creaming curve, now being displayed at this stage of exploration and discovery.
Conclusion
Next week I continue the discussion on the details of my justification.
