For the fourth week in succession, I shall continue my evaluation of the cost-price-profit profile for Guyana’s expected petroleum sector. A reasonably accurate depiction of this profile is necessary for reliably estimating petroleum revenues. The focus of today’s column is to introduce those unit cost studies that have most influenced my choice of an indicative unit cost range to apply when projecting petroleum revenues. Before addressing that topic, however, I offer, as promised last week, brief comments on the two matters that space had precluded me from considering then.
These matters are firstly, the source of the “pro forma template” that I used to illustrate the items, which make up the total/unit cost of production; and, secondly, the “two options” I had alluded to for obtaining such cost data from the international oil companies (IOCs) presently contracted to develop Guyana’s petroleum sector
Cost Template
In practice, there is significant variation in representing the items that constitute crude petroleum cost. The cost template that I presented last week is derived from two academic cost studies. These are: G. Toews, and A. Naumov, 2015: “The relationship between oil price and costs in the oil and gas industry”; and C. Aublinger, 2015: “How much does it cost to produce one barrel of oil (143 companies in 2014)?”
Two Options
Similarly, in my portrayal of ExxonMobil (and partners) seemingly changing approach to the voluntary declaration of their unit production cost during the course of 2018, I had promised to expand on this matter, this week. As indicated last week, there are two options on the matter; one is voluntary disclosure, and the other is legal compulsion.
While one might expect that voluntary publication of this data could generate enormous goodwill for the IOCs and the Government, two considerations apply. First, in Guyana’s “negative petroleum environment,” it could result in the direct opposite. That is, the prevailing public skepticism could indeed make publication of unit cost by the IOCs a source of never-ending attacks on their accuracy.
Second, international law and practice support the “right” of commercial entities (both private and/or state-owned), to keep “confidential” their production costs for competitiveness and security reasons (insider trading and other market-related violations). Therefore, the judgement government has to make, hinges on its capability to discern their unit costs, after petroleum production commences, because of State monitoring and surveillance. Compelling a massive private company to disclose publicly its cost data in a competitive global environment is high risk. In particular, the IOC (Contractor) and the Government (Owner) can easily slide into adversarial relations. Without one unit of crude oil and gas produced to date, clearly such action is potentially suicidal!
Instead, the Guyana environment has to be kept constantly at the forefront. The consistent ill-informed public interventions by self-appointed “experts” and their even less-informed hollow echo chambers add to the amplification of the noise surrounding Guyana’s coming petroleum sector. There is every reason to believe any cost data supplied by an IOC, regardless of its accuracy, will be disputed. In such circumstances, the intelligent solution is to encourage several independent petroleum research and advocacy analysis’ firms to undertake unit cost studies on Guyana’s crude petroleum output.
Supporting Data
In order to advance the discussion on Guidepost 6, I now refer to those studies/cost data for Guyana that have had the most influence on my arrival at an indicative unit cost range. There are four such sources. These are listed in the order of significance: 1) Hess Corporation’s Presentation to a Barclays Bank Conference (2018); 2) the K. Allen, L. Layne, M. Sourosh, University of Trinidad and Tobago, Conference Presentation on the Liza 1 field (2018); 3) the Open Oil FAST Model Presentation (2018); and 4) a variety of other estimates from worldwide studies. I expand on these in the order indicated.
1: Barclays Energy — Power Conference
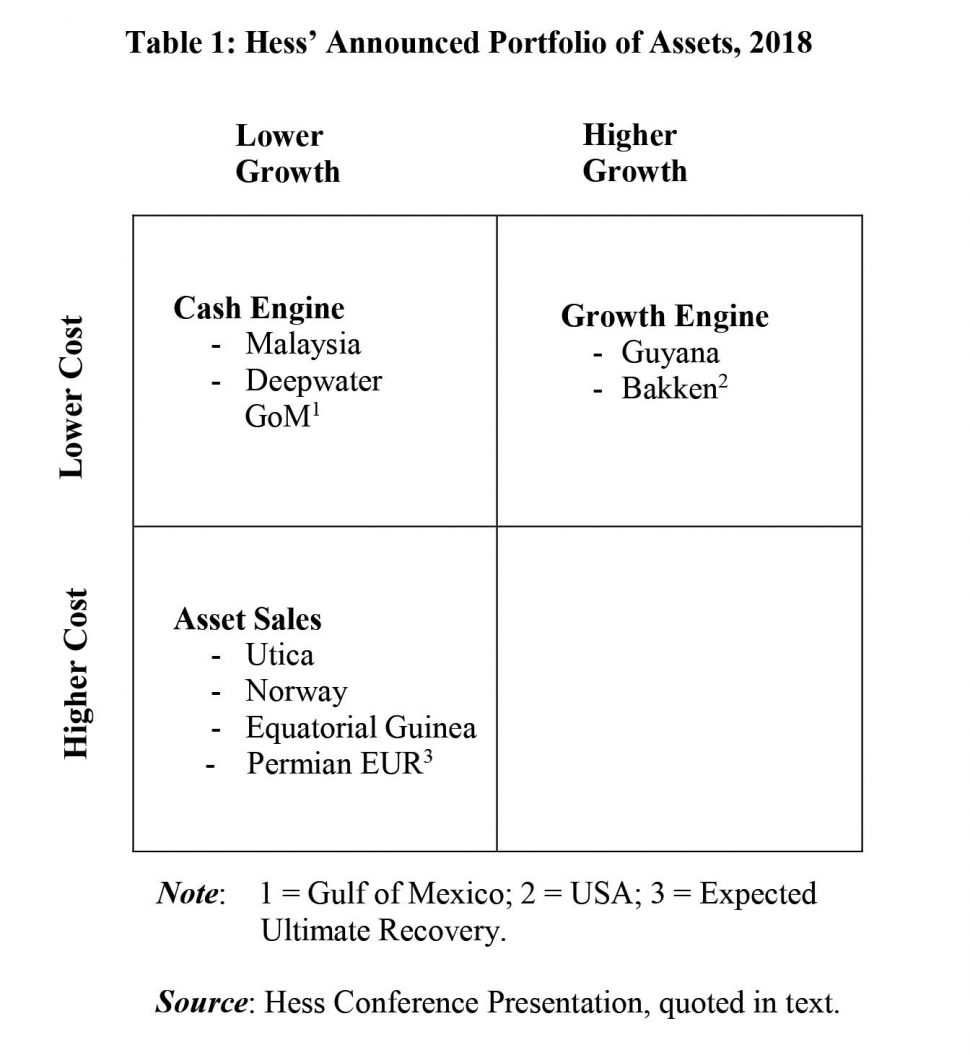
At the Barclays Bank, Chief Executive Officer (CEO) “Power-Energy” Conference last September, (2018), Hess Corporation’s CEO reported that the Corporation was focusing on “lower cost, higher return assets.” To attain this portfolio preference, it sees its Guyana holdings as a “growth engine.” Relatedly, Hess also identified its Bakken (USA) holdings as the other growth engine and its Malaysia/Gulf of Mexico holdings as “cash engines.”
Hess’ Guyana holdings were projected to yield “capital efficient production growth.” This growth was projected at around 10% per annum up to 2023. Over the same period, cash unit costs were also projected to decline by 30 percent, and, its cash flow growth (if Brent was at US$60 per barrel), would be around 25% per annum through to 2023. For Guyana these attainments were categorised as “industry leading returns and cost metrics.” Further, the CEO indicated that its “asset-sales” (see last week’s pro forma cost template) had prefunded its Guyana’s investment.
Hess Corporation also emphasised that its Guyana prospect is “multi-phased, offering attractive returns as well as projecting rapid cash payback.” In the paper, the CEO spoke directly to Liza phases 2 and 3 activities as well as continuation of other exploration and appraisal activities.
The Hess portfolio model is illustrated by a matrix used in the CEO’s paper (reproduced below). In that matrix, Guyana is in “the higher growth, lower cost” northeastern quadrant, which Hess identifies as: 1) having cash costs less than US$10 per barrel of oil equivalent; 2) a projected 20% cumulative annual growth rate (CAGR); and 3) accounting for 75% of its cumulative E&P capital. Capital allocation here over the period 2018-2020 is projected to be 75% of the total!
Conclusion
Next week I expand on this discussion of Hess’ assets portfolio. I present also its cost metrics as the CEO indicated at the Conference (including Hess’ estimates of the breakeven price for the Liza Phase 1, along with comparisons/contrasts to the United States shale sector).


