Introduction
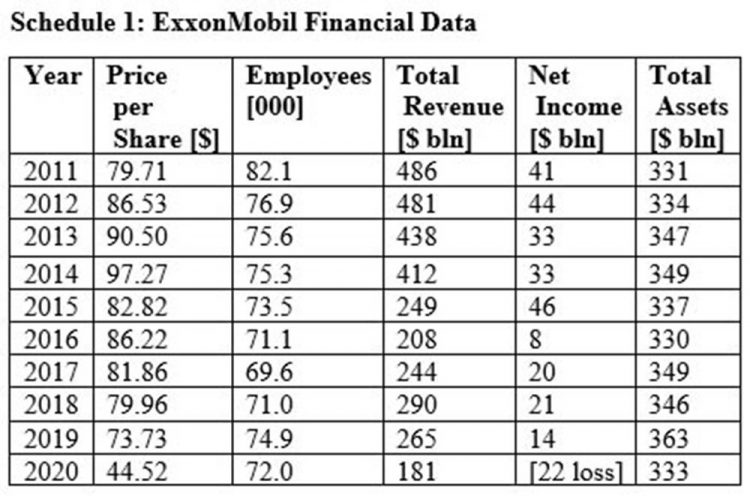
As indicated last week, because of space constraints, this week’s column begins with my introduction of a Schedule that I could not have presented then. The Schedule summarizes a decade-long time series [2011- 2020] of financial data on ExxonMobil, which I had discussed in last week’s column. This is presented today in Schedule 1 below. Today’s column seeks to advance the analysis further through focusing on an evaluation of whether ExxonMobil is currently either 1) on the cusp of a turnaround out of the entrapment of zombification, or 2) whether it is locked in stasis, or indeed 3) locked in a phase leading to terminal insolvency.
Literature preview
Worldwide, there are scores of individual stock analysts, business intelligence firms, research institutions, regulatory bodies and media houses that periodically make public professional assessments and pronouncements on the past and future performance of ExxonMobil, both as a Fortune 500 company and leading firm in the oil, gas and wider energy sector, globally, regionally and nationally. It appears to me that, their present views/ judgements on ExxonMobil would fall into one of the three categories outlined immediately above. I have read a sample of these publications and my view is that there are hints of a possible turnaround.
In the next Section I offer readers a basic depiction of one private business intelligence and research firm’s assessment of the ExxonMobil stock turnaround. The firm is Envision Research. It has published two stock reviews (September 2021 and January 2022), in Seeking Alpha.
Key takeaways
There are at least five key takeaways from these stock analyses. They are summarized in what follows below:
1) For ExxonMobil, its stock situation at Q1 2022 compared to that at Q3 2021 had clearly “turned a corner” because profitability had returned to the company
2) A decent long-term return seems feasible based on price forecasts for crude oil post pandemic and ExxonMobil breakeven price (US$45 per barrel) and a target price of US$80 per barrel
3) Indeed, by January 2022 ExxonMobil stock had reached a 52-week high
4) Over the very long-term, the company in order to flourish will have to concentrate on its renewables along with green energy technology and reduced carbon emissions
5) And, finally, ExxonMobil will have to turn to its long-term fundamentals in order to secure its capacity to finance its own organic growth
In what follows I focus on the model used by Envision Research in support of the takeaways l have listed above. Two Envision Research articles reveal the logic informing the takeaways; namely, “ExxonMobil has turned a corner”; and ‘ExxonMobil: 52 week high is only the beginning”.
The Model
Based on ExxonMobil’s long-term fundamentals as a US Fortune 500 company, its long-term growth rate can be simply expressed as: Long-term Growth Rate = ROCE x Reinvestment Rate
(where ROCE stands for the return on capital employed). Non-specialist readers must keep in mind that ROCE is not the return on equity. It is more fundamental. It is a return on capital that ExxonMobil actually employs. That is what is does invest or provide in order to earn a given extra amount of income.
The reinvestment rate is the portion of the income ExxonMobil plows back into the business in order to fuel further growth
To proceed with the analysis of ExxonMobil’s long-term growth rate, one needs to analyze two separate variables. Those are the ROCE and the reinvestment rate. This follows next.
Return on Capital Employed
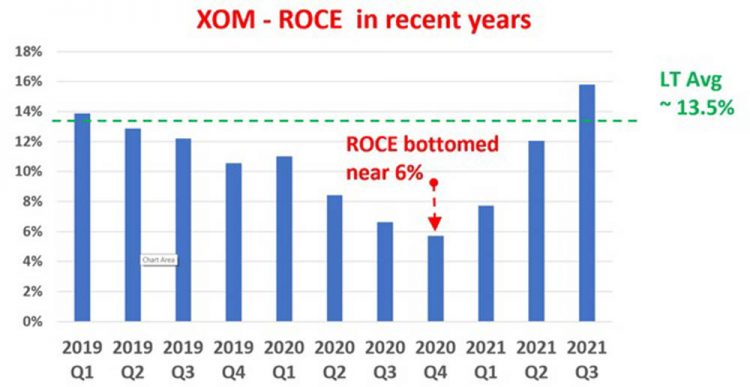
ExxonMobil’s ROCE is revealed in a Chart constructed by Envision Research in the reference material cited above. This is reproduced and displayed below.
Envision Research based on Seeking Alpha data
It has been reportedly calculated from quarterly financials for Q1 2019 to Q3 2021. In the Chart, Capital Employed represents: 1) Working Capital [payables and receivables], 2) Net Property Plant and Equipment, and 3) Research and Development expenses.
The Chart clearly indicates ExxonMobil’s ROCE has nosedived since 2019 Q1. It dropped precipitously from a long-term average of 13.5% to a bottom of about 6% in Q3 2020; a period in which the COVID 19 pandemic has wreaked great havoc. Despite several remaining challenges, the worst might well lie now in the rearview mirror as its profitability has turned a corner, demonstrating a V-shaped type recovery. To be honest the current ROCE is at a quite healthy 15.8%. In absolute terms the Chart shows this is also higher than its long-term average by 230 basis points (or about 20% in relative terms).
Conclusion
Next week I continue with a focus on the second variable determining ExxonMobil’s long-term growth rate and its prospects; namely the Reinvestment Rate, RR.


