Dear Editor,
There has been a plethora of letters in mainstream media blaming the PPP/C administration for allegedly practising race discrimination, and for engaging in the furtherance of marginalization and thus creating deeper levels of poverty, and with the victims belonging to one ethnic group.
These critics and advocates have the right to defend and promote the welfare of their ethnic group if they perceive that such rights are being threatened or eroded.
However, if they do not produce evidence to buttress their cause, this will not play to their advantage. To make claims that Afro-Guyanese experience twice the rate of poverty than any other ethnic group in Guyana is not only false and alarmist, but also insipid.
Mr. Nigel Hinds, for example, asserted in a letter to Stabroek News (11/29/20020): “A country cannot be governed in a multi-racial manner, when the poverty rate of one group is double the poverty rate of any other race group, it simply means that the governance is not multi-racial but instead the governing administration is implementing racist policies, projects and programs.” The ethnic group that has the highest poverty level is not Afro-Guyanese but the Amerindians.
Making incendiary remarks that are devoid of evidence is dangerous. There has not been any systematic study on poverty beyond 2006, except for the World Bank’s (WB) study of 2019 for which details are not yet available.
Economist Dr Tarron Khemraj referring to the “Household Income and Expenditure Survey” in 2006 noted that Afro-Guyanese had a poverty rate of 31.6%; Indo-Guyanese’ had a rate of 30%; Mixed had a rate of 33.7%; and the national rate was 35%. (This national rate was also reported in IMF Article IV Consultation:2022). Astonishingly, the Amerindian poverty rate (of 73.5%) was doubled the national rate of 35%. It should be noted that the poverty rates cited by these organizations were based on a baseline of $(US) 2.15 per day.
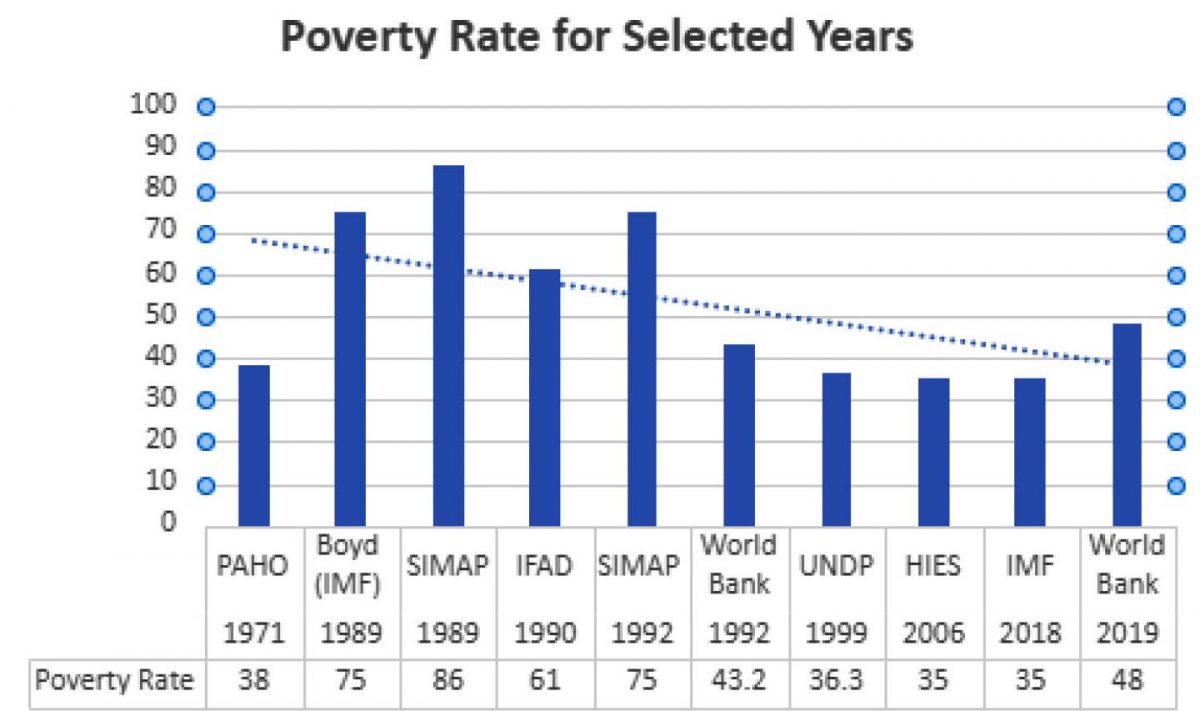
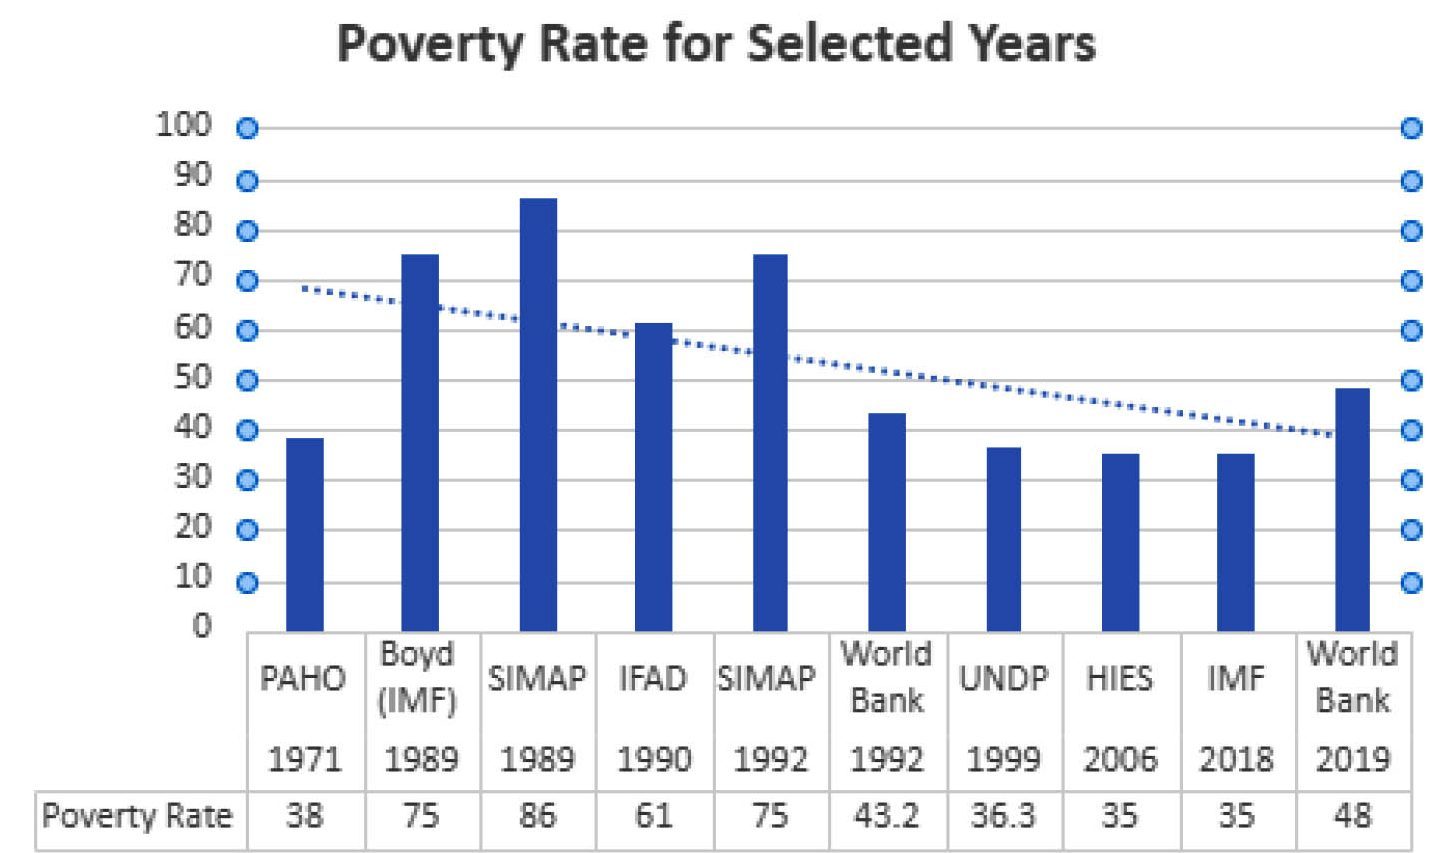
The World Bank (WB) report does not carry an ethnic breakdown of poverty. What is known however is that during the period 1993 to 2006 the national level of poverty declined by 7.1% with an ethnic breakdown as follow: Afro-Guyanese rate declined by 11.4%; Amerindians’ rate declined by 12.5%; Indo-Guyanese declined by 3.7%; and Mixed by 11.0%. When translated into raw figures, it shows “89,248 Indo-Guyanese lived below the poverty line compared to 69,041 for Afro-Guyanese, 58,869 for Amerindians and 50,055 for Mixed people.” (Gampat: 2021). Whether the declining trend in poverty reduction across all ethnic groups has continued beyond 2006 is not known but at the national level, the WB report indicates a poverty reduction rate during the period 2006 to 2019 from 61% to 48% (using a new baseline for poverty at $(US) 5.50 per day consequent upon Guyana being reclassified as an upper middle- income country). It is noted that the different poverty rates as shown in the chart are due to different methodological approaches.
Closely related to poverty is income inequality for which some data are available. A popular method of measuring income/consumption inequality is by the Gini coefficient. Dr Khemraj citing a CIA report, noted that Gini coefficients were calculated on 2007 data on a scale of 0 to 100, with 0 representing perfect equality and 100 representing extreme inequality. Guyana’s score of 45 was slightly better than Jamaica with a score of 46 and Suriname with a score of 53. However, Trinidad and Tobago and Barbados scored better than Guyana (39 and 40 respectively). While an ethnic breakdown is not available, there is greater disparity in income between urban and rural/hinterland areas with the latter having higher levels of income inequality than urban areas.
While ethnic based data on income inequality are not available, it is logical that current research would show that income inequality would narrow and that the poverty levels across all ethnic groups would decline, given the rapid expansion of investments in both the oil and non-oil sectors and the growing wealth of Guyana (GDP more than doubled between 2014 and 2022). This growth allows for fairer distribution of state resources through several ongoing regional empowerment projects in education, health, housing, physical infrastructure, job creation, and neighborhood revitalization. The 2022 Census might provide insights into poverty and income inequality as well as other critical issues. Rhetorical flourishes are no substitute for evidence.
Yours faithfully,
Dr Tara Singh


