Introduction
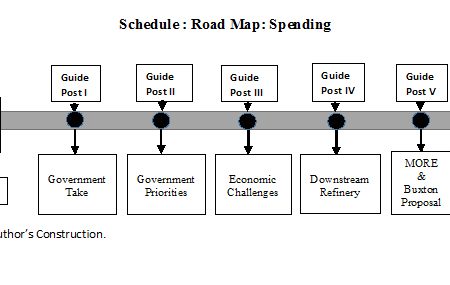
Today’s column wraps-up my discussion on spending petroleum revenues on long-term priorities
Of the Government of Guyana, (GoG), as represented in Guidepost 2 of Part 2 of the Guyana Petroleum Road Map.
Introduction
Last week I had raised several critical conceptual and analytical concerns related to what I labelled as “the Government of Guyana’s (GoG) well underway priority” of establishing a Sovereign Wealth Fund (SWF)//Natural Resources Fund (NRF).
Introduction
Discussing Guidepost 2 of Part 2, I began last week with identifying three general areas of public spending of petroleum revenues indicated by the Government of Guyana (GoG) thus far.
Introduction
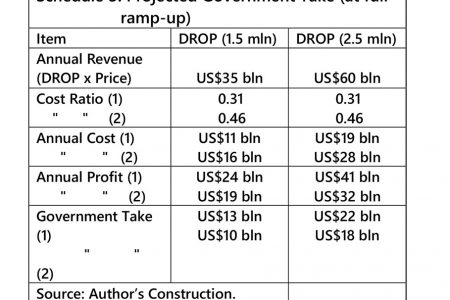
A significant number of readers have asked me to clarify/expand/repeat more simply the way in which I arrived at the “back of the envelope” or “ballpark estimates” of annual Guyana Government Take, which I offered in last week’s column.
Introduction
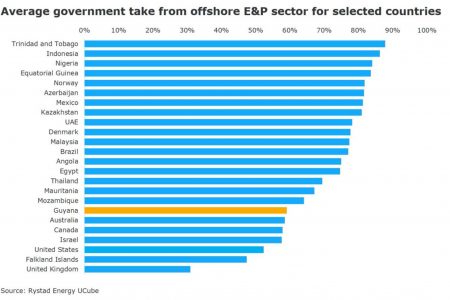
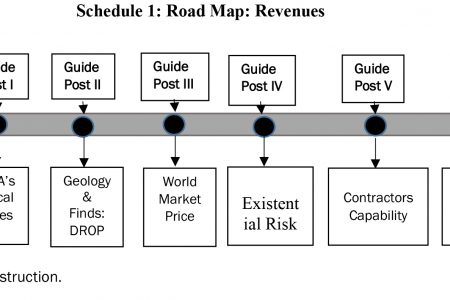
Today’s column measures the impact of applying my values for production, price, and Government Take (indicated in Part 1 of Guyana’s Petroleum Road Map), to Rystad Energy’s analytics.
Introduction
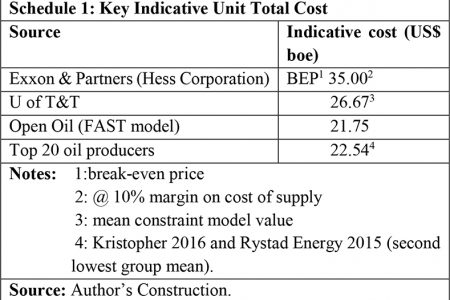
Last Sunday’s column concluded my discussion of Guidepost 6. It also provided the indicative unit total cost range for a barrel of oil equivalent (boe) which I shall apply to the estimation of Guyana’s likely petroleum revenues, after cost, for the remainder of the Road Map, going forward.
Introduction
Last week’s column wrapped-up my discussion of break-even prices, both from a business (commercial) perspective and a fiscal and their relation to the unit total cost of Guyana’s crude oil exports.
Introduction
Today’s column links my ongoing assessment of Guidepost 6 in Guyana’s Petroleum Road Map (that is, the average (unit) total costs for its crude oil export) to my previous presentations in this series on Guyana’s projected indicative price range per barrel of oil equivalent (boe) for its expected petroleum exports.
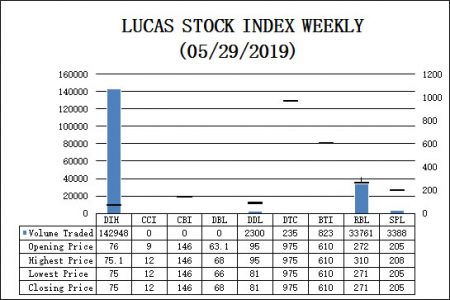
Last Update: 558.05 Movement: 3.73%
Current Update: 537.22 YTD Movement: 4.34%
The Lucas Stock Index (LSI) declined 3.73% during the fourth period of trading in May 2019.
Introduction
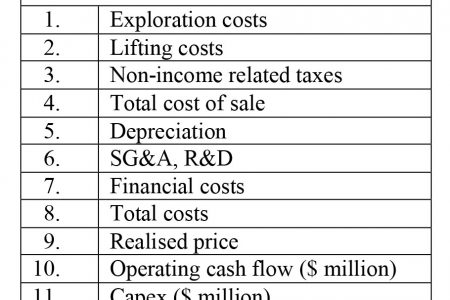
Under Guidepost 6 of Guyana’s Petroleum Road Map, in its dimension for “getting petroleum revenues” I have offered, thus far, three sets of unit cost metrics, which were completed in 2018.
Introduction
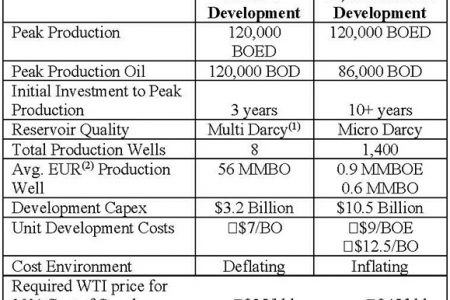
For the purposes of Guidepost 6 as listed in my presentation of Guyana’s Petroleum Road Map for its dimension of “assessing expected petroleum revenues”, I have already considered Hess Corporation’s cost metrics.
Introduction
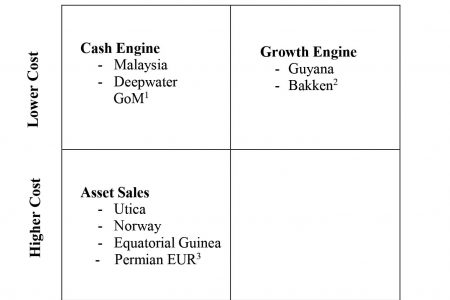
In last week’s column, I had introduced Hess Corporation’s oil assets portfolio as presented by its Chief Executive Officer (CEO) to the “Barclays Energy — Power Conference,” held in September, 2018.
Introduction
For the fourth week in succession, I shall continue my evaluation of the cost-price-profit profile for Guyana’s expected petroleum sector.
Introduction
Today’s column continues my presentation on Guidepost 6. As observed earlier, this Guidepost is crucial for my estimating Guyana’s anticipated petroleum revenues.